

Consanguinity in Centre d'Étude du Polymorphisme Humain (CEPH) pedigrees
- PMID: 22274586
- PMCID: PMC3355261
- DOI: 10.1038/ejhg.2011.266
Consanguinity in Centre d'Étude du Polymorphisme Humain (CEPH) pedigrees
Abstract
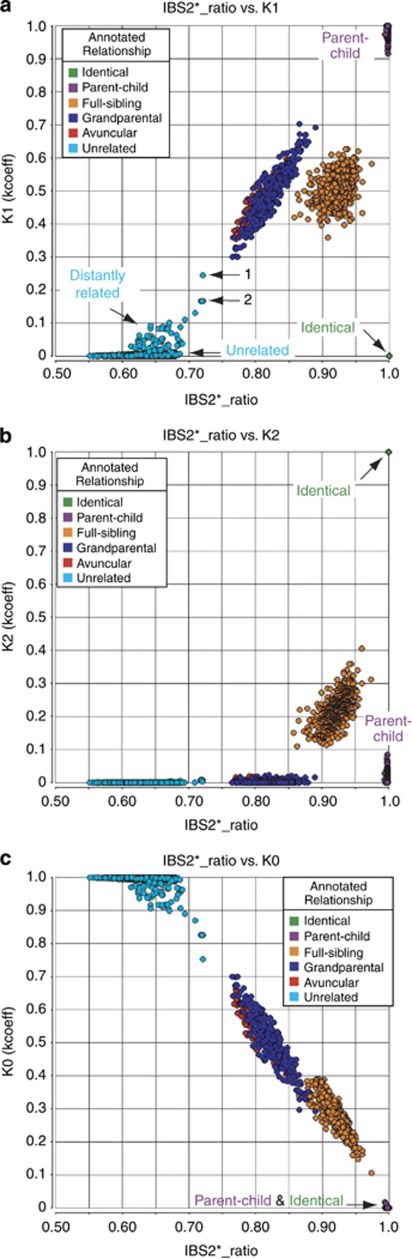
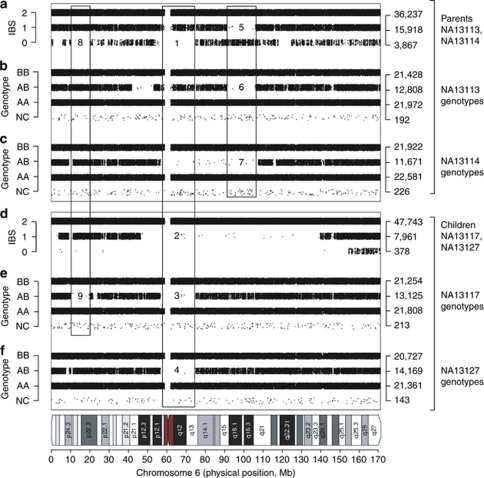
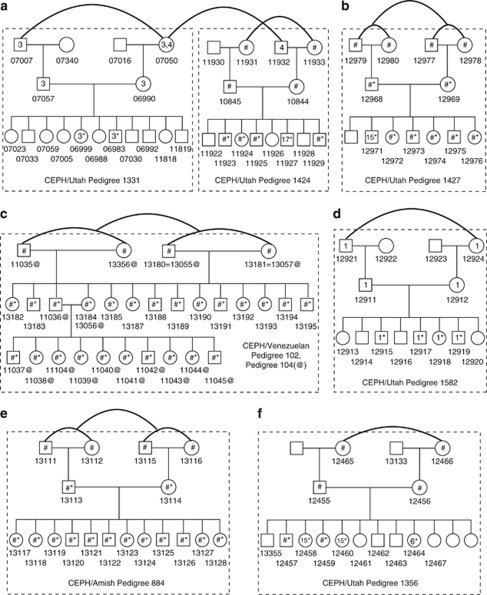
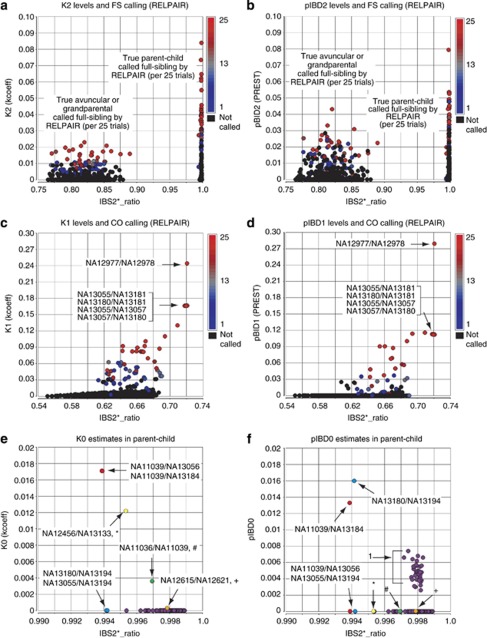
A set of Centre d'Étude du Polymorphisme Humain (CEPH) cell lines serves as a large reference collection that has been widely used as a benchmark for allele frequencies in the analysis of genetic variants, to create linkage maps of the human genome, to study the genetics of gene expression, to provide samples to the HapMap and 1000 Genomes projects, and for a variety of other applications. An explicit feature of the CEPH collection is that these multigenerational families represent reference panels of known relatedness, consisting mostly of three-generation pedigrees with large sibships, two parents, and grandparents. We applied identity-by-state (IBS) and identity-by-descent (IBD) methods to high-density genotype data from 186 CEPH individuals in 13 families. We identified unexpected relatedness between nominally unrelated grandparents both within and between pedigrees. For one pair, the estimated Cotterman coefficient of relatedness k1 exceeded 0.2, consistent with one-eighth sharing (eg, first-cousins). Unexpectedly, significant IBD2 values were discovered in both second-degree and parent-child relationships. These were accompanied by regions of homozygosity in the offspring, which corresponded to blocks lacking IBS0 in purportedly unrelated parents, consistent with inbreeding. Our findings support and extend a 1999 report, based on the use of short tandem-repeat polymorphisms, that several CEPH families had regions of homozygosity consistent with autozygosity. We benchmarked our IBD approach (called kcoeff) against both RELPAIR and PREST software packages. Our findings may affect the interpretation of previous studies and the design of future studies that rely on the CEPH resource.
Figures
Similar articles
-
Unexpected relationships and inbreeding in HapMap phase III populations.PLoS One. 2012;7(11):e49575. doi: 10.1371/journal.pone.0049575. Epub 2012 Nov 19. PLoS One. 2012. PMID: 23185369 Free PMC article.
-
Inference of relationships in population data using identity-by-descent and identity-by-state.PLoS Genet. 2011 Sep;7(9):e1002287. doi: 10.1371/journal.pgen.1002287. Epub 2011 Sep 22. PLoS Genet. 2011. PMID: 21966277 Free PMC article.
-
Long homozygous chromosomal segments in reference families from the centre d'Etude du polymorphisme humain.Am J Hum Genet. 1999 Dec;65(6):1493-500. doi: 10.1086/302661. Am J Hum Genet. 1999. PMID: 10577902 Free PMC article.
-
CEPH maps.Curr Opin Genet Dev. 1992 Jun;2(3):393-9. doi: 10.1016/s0959-437x(05)80148-0. Curr Opin Genet Dev. 1992. PMID: 1504612 Review.
-
The use of linkage analysis and the Centre d'Etude Polymorphisme Humain (CEPH) panel of DNA in the study of the arginine vasopressin, oxytocin and prodynorphin gene loci.Prog Brain Res. 1992;93:309-17. doi: 10.1016/s0079-6123(08)64581-1. Prog Brain Res. 1992. PMID: 1362280 Review. No abstract available.
Cited by
-
Analysis of 100 high-coverage genomes from a pedigreed captive baboon colony.Genome Res. 2019 May;29(5):848-856. doi: 10.1101/gr.247122.118. Epub 2019 Mar 29. Genome Res. 2019. PMID: 30926611 Free PMC article.
-
Balancing selection at the human salivary agglutinin gene (DMBT1) driven by host-microbe interactions.iScience. 2022 Apr 1;25(5):104189. doi: 10.1016/j.isci.2022.104189. eCollection 2022 May 20. iScience. 2022. PMID: 35494225 Free PMC article.
-
Pedigree-based estimation of human mobile element retrotransposition rates.Genome Res. 2019 Oct;29(10):1567-1577. doi: 10.1101/gr.247965.118. Genome Res. 2019. PMID: 31575651 Free PMC article.
-
Genome-wide patterns of identity-by-descent sharing in the French Canadian founder population.Eur J Hum Genet. 2014 Jun;22(6):814-21. doi: 10.1038/ejhg.2013.227. Epub 2013 Oct 16. Eur J Hum Genet. 2014. PMID: 24129432 Free PMC article.
-
Unexpected relationships and inbreeding in HapMap phase III populations.PLoS One. 2012;7(11):e49575. doi: 10.1371/journal.pone.0049575. Epub 2012 Nov 19. PLoS One. 2012. PMID: 23185369 Free PMC article.
References
-
- NIH/CEPH Collaborative Mapping Group. A comprehensive genetic linkage map of the human genome. Science. 1992;258:67–86. - PubMed
-
- NIH/CEPH Collaborative Mapping Group. A comprehensive genetic linkage map of the human genome. Science. 1992;258:148–162. - PubMed
-
- Weissenbach J, Gyapay G, Dib C, et al. A second-generation linkage map of the human genome. Nature. 1992;359:794–801. - PubMed
-
- Prescott SM, Lalouel JM, Leppert M. From linkage maps to quantitative trait loci: the history and science of the Utah genetic reference project. Annu Rev Genomics Hum Genet. 2008;9:347–358. - PubMed
-
- International HapMap Consortium: The International HapMap Project. Nature. 2003;426:789–796. - PubMed
Publication types
MeSH terms
Grants and funding
LinkOut - more resources
Full Text Sources
