. 2012 Mar;18(3):434-48.
doi: 10.1261/rna.030999.111. Epub 2012 Jan 24.

Folding of the hammerhead ribozyme: pyrrolo-cytosine fluorescence separates core folding from global folding and reveals a pH-dependent conformational change

Affiliations

Folding of the hammerhead ribozyme: pyrrolo-cytosine fluorescence separates core folding from global folding and reveals a pH-dependent conformational change

Iwona A Buskiewicz et al. RNA. 2012 Mar.

Abstract

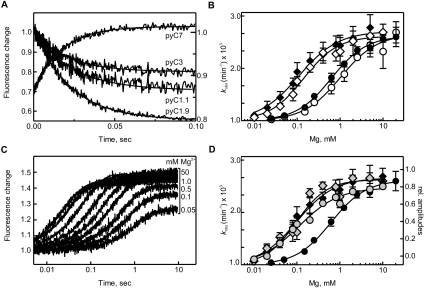
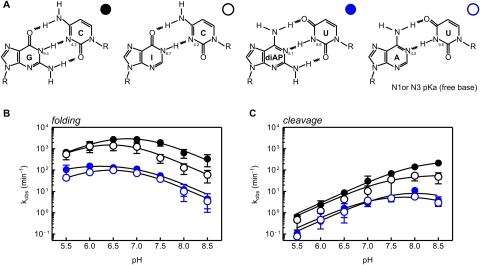
The catalytic activity of the hammerhead ribozyme is limited by its ability to fold into the native tertiary structure. Analysis of folding has been hampered by a lack of assays that can independently monitor the environment of nucleobases throughout the ribozyme-substrate complex in real time. Here, we report the development and application of a new folding assay in which we use pyrrolo-cytosine (pyC) fluorescence to (1) probe active-site formation, (2) examine the ability of peripheral ribozyme domains to support native folding, (3) identify a pH-dependent conformational change within the ribozyme, and (4) explore its influence on the equilibrium between the folded and unfolded core of the hammerhead ribozyme. We conclude that the natural ribozyme folds in two distinct noncooperative steps and the pH-dependent correlation between core folding and activity is linked to formation of the G8-C3 base pair.


Figures

FIGURE 1.
FIGURE 1.
(A) Secondary structure of the Schistosoma mansoni hammerhead ribozyme construct used in this study. This representation emphasizes the global geometry as seen in the first crystal structure of the S. mansoni ribozyme (Martick and Scott 2006). Enzyme strand (black); the substrate (gray); and positions of nucleotides replaced with the fluorescent analog (boxed). Outlined letters (C17, G8, and G12) indicate core nucleotides essential for catalysis, and the cleavage site is marked with a black arrow; the canonical 8-3 Watson-Crick base pair is shown as a black double line. Thick black and gray lines indicate backbone continuity, where the sequence has been separated for diagrammatic clarity. Base numbering is according to Hertel (Hertel et al. 1992). The dotted line in the region of Loop 1 shows the truncation position of the substrate and ribozyme strands to form the minimal form of the ribozyme lacking the tertiary interaction. (B) Structure of pyrrolo-cytosine (pyC) and (C) pyrrolo-cytosine–guanosine base pair (pyC-G).
FIGURE 2.
FIGURE 2.
Folding of S. mansoni hammerhead ribozyme as observed by pyC fluorescence changes in stopped-flow fluorimeter. (A) Time courses of hammerhead ribozyme–substrate (noncleavable) complex folding upon exposure to 10 mM Mg2+, in the presence of 50 mM Tris-HCl and 100 mM NaCl (pH 7.0) at 25°C, as reported at positions in the Loop II (pyC1.9), Stem I (pyC1.1), and core region (pyC3 and pyC7). The displayed curves are averages of at least four measurements. The smooth lines represent the fit (see Materials and Methods). (B) kobs (per minute) for folding plotted as a function of Mg2+ concentration. The data have been fitted to a two-state binding model yielding a Hill coefficient equal ∼1 for all analyzed variants and an apparent dissociation constant [Mg2+]1/2: 0.12 (±0.01) mM for pyC1.9 (black diamonds); 0.14 (±0.03) mM for pyC1.1 (open diamonds); 0.8 (±0.2) mM for pyC3 (open circles); and 1.0 (±0.03) mM for pyC7 (black circles). (C) An example of time courses of folding monitored in the core of the ribozyme at position pyC7 with increasing Mg2+ concentration. Please note earlier amplitude than observed rate constant saturation with increasing Mg2+ concentration. (D) Comparison of Mg2+ dependence of the apparent kobs for pyC1.9 and pyC7 (black diamonds and circles) with Mg2+ dependence of their relative fluorescence amplitudes (gray diamonds and circles, respectively). (Left y-axis) kobs; (right y-axis) normalized relative amplitudes. The fluorescence amplitudes were normalized so that the maximal fluorescence amplitude observed in each experiment was valued at 1. The apparent dissociation constant established from changing fluorescence amplitudes was [Mg2+]1/2: 0.09 (±0.01) mM for pyC1.9 (gray diamonds) and 0.11 (±0.03) mM for pyC7 (gray circles).
FIGURE 3.
FIGURE 3.
pH dependence of fluorescence-detected folding of the S. mansoni hammerhead ribozyme. The folding experiments at different pH values were performed in a stopped-flow fluorimeter by addition of Mg2+ (10 mM) to a pre-annealed complex of ribozyme and noncleavable substrate (1 μM). The folding reactions were carried out at 25°C in the presence of 100 mM NaCl and 50 mM MES (pH 5–6), MOPS (pH 6.5–7.5), HEPES (pH 7.0–8.0), TRIS (pH 7.5–8.5), TAPS (pH 8.2–8.9), and CHES (pH 8.5–9.0). The folding traces were fitted as described in Materials and Methods. Extracted, log apparent rate constants kobs (per minute) were plotted as a function of pH. The differences in the apparent rate of folding for loop pyC1.9 (black diamonds) and Stem I pyC1.1 (open diamonds) at different pH values did not exceed 10%. The apparent rate of folding for core residues pyC7 (black circles) and pyC3 (open circles) shows at least a one order of magnitude lower rate of folding at high and low pHs as compared with pH 7.0. The apparent bell-shaped curve could be fitted to a Henderson–Hasselbalch-type equation (see Materials and Methods) yielding two apparent pKa values of 6.3 (±0.2) and 7.4 (±0.1).
FIGURE 4.
FIGURE 4.
Comparison of pH dependence of cleavage and folding for the S. mansoni hammerhead ribozyme and its G8-C3 base pair Watson-Crick analogs. (A) Structure of the G8-C3 Watson-Crick base pair (black circle) and analog pairs of I8-C3 (open, black circles), diAP8-U3 (blue circles), and A8-U3 (open, blue circles). The respective pKa values of N1 of purines and N3 of pyrimidines are highlighted. (B) pH-dependent folding as monitored by fluorescence change of core pyC7 of G8-C3 and analog base pair variants. The folding data were acquired, fitted, and plotted as described for G8-C3 folding in Figure 3 and Materials and Methods. Each of the analyzed variants yielded two apparent pKas of folding: 6.1 (±0.3) and 6.8 (±0.2) for I8-C3; 5.5 (±0.1) and 7.1 (±0.2) for diAP8-U3; 5.9 (±0.1) and 6.9 (±0.1) for A8-U3 as compared with 6.3 (±0.2) and 7.4 (±0.1) for G8-C3. (C) pH-dependent cleavage assays were performed under single turnover conditions with the same buffer, salt, and Mg2+ concentrations as described for folding experiments in Figure 3. The resulting apparent rate constants for cleavage were plotted as a function of pH and fitted to the Henderson–Hasselbalch equation yielding one apparent pKa value of 8.4 (±0.2) for G8-C3 and 8.0 (±0.2) for I8-C3. For diAP8-U3 and A8-U3, the pH dependence of cleavage resembles a bell-shaped profile, and curve fitting yielded two pKas. The best fit was obtained when the second pKa was constrained to >8.5 and then the fit yielded the upright pKa of 7.5 (±0.3) for diAP8-U3, 7.0 (±0.2) for A8-U3. For the clarity of the graphs, we have displayed only every 0.5 pH unit datum. For the very low and high pH conditions, the cleavage and folding were performed in smaller increments than displayed. (Instead of 0.5 pH unit, 0.2 increments were tested, starting at pH 5 and ending at pH 9, respectively. pH 9 and 5 were not included in the fit.) The values are summarized in Tables 1–3.
FIGURE 5.
FIGURE 5.
The pH dependence of cleavage and folding for wobble-like 8-3 base-pair variants. (A) G8-U3 (black squares), diAP8-C3 (gray squares), and A8-C3 (green squares) (B) pH-dependent folding as monitored by the fluorescence change of pyC7 of wobble-like 8-3 base-pair analogs. The data were acquired, fitted, and plotted as described for G8-C3 folding in Figure 4. Folding of the analyzed variants yielded a bell-shaped pH profile, and fit resulted in two apparent pKas of folding of 5.5 (±0.3) and 6.9 (±0.2) for G8-U3; 6.1 (±0.6) and 6.9 (±0.3) for diAP8-C3; 6.2 (±0.4) and 6.7 (±0.5) for A8-C3. (C) pH-dependent cleavage assays were performed as described for 8-3 analogs in Figure 4. pH dependence of cleavage for each of the analyzed variants yielded a bell-shaped profile, and curve fitting revealed two apparent pKas of 7.9 (±0.4) and >8.5 for G8-U3; 6.7 (±0.4) and 8.1 (±0.3) for diAP8-C3; 6.9 (±0.2) and 8.1 (±0.3) for A8-C3.
FIGURE 6.
FIGURE 6.
Comparison of pH-dependent core folding and cleavage of unmodified G8 (closed, black circle), diAP8 (closed, gray squares), diAP12 (open, black triangle), and double diAP8-diAP12 (black triangle) in the background of both minimal (A,B) and natural (C,D) S. mansoni hammerhead ribozyme. The pH-dependent core folding (pyC7) was performed as described in Figure 3. Folding of the analyzed minimal ribozyme and variants yielded an almost-flat pH profile, where the differences between high, moderate, and low pH did not exceed twofold, and fit resulted in two apparent pKas of folding that are rather approximations of ∼5.5 (±1.7) and 8.5 (±0.9) for G8-G12; ∼6.0 (±1.5) and 8.0 (±0.9) for diAP12; 6.2 (±1.4) and 8.0 (±0.9) for diAP8; and ∼6.2 (±1.3) and 8.0 (±1.4) for diAP8-diAP12. The same experiments performed in the background of the natural ribozyme yielded pKas of 6.3 (±0.2) and 7.4 (±0.1) for G8-G12; 6.5 (±0.4) and 7.4 (±0.5) for diAP12; 6.1 (± 0.6) and 6.9 (±0.3) for diAP8; 6.2 (±0.3) and 6.9 (±0.5) for diAP8-diAP12. The pH-dependent cleavage reactions of minimal (B) and natural (D) ribozymes were performed as described in Figure 4. The pH-dependent cleavage for unmodified minimal ribozyme is log linear with pKa higher than 9. Cleavage of the minimal ribozyme single and double G8-G12 variants yielded bell-shaped pH profiles and resulted in two apparent pKas: 5.7 (±0.4) and 8.5 (±0.3) for diAP12; 6.1 (±0.3) and 7.7 (±0.3) for diAP8; 5.9 (±0.2) and 7.7 (±0.6) for diAP8-diAP12. The same pH profiles for natural ribozyme yielded a log-linear activity increase for unmodified ribozyme with a slight leveling off at pH 8.5, yielding an apparent pKa of 8.4 (±0.2). The single diAP8 mutation showed a bell-shaped profile of cleavage, which resulted in apparent pKas of 6.7 (±0.4) and 8.1 (±0.3). Both single diAP12 and double diAP8-diAP12 variants showed too small differences in cleavage across the analyzed pH (twofold) to obtain reliable fit; consequently, the pKas were assigned to be <5.5 and >8.5. For clarity of the graph, the cleavage values for diAP8-diAP12 were incremented by 0.05 pH unit.

Similar articles

Cited by

References

    1. Bassi GS, Murchie AI, Walter F, Clegg RM, Lilley DM 1997. Ion-induced folding of the hammerhead ribozyme: A fluorescence resonance energy transfer study. EMBO J 16: 7481–7489 - PMC - PubMed
    1. Berry DA, Jung K-Y, Wise DS, Sercel AD, Pearson WH, Mackie H, Randolph JB, Somers RL 2004. Pyrrolo-dC and pyrrolo-C: Fluorescent analogs of cytidine and 2′-deoxycytidine for the study of oligonucleotides. Tetrahedron Lett 45: 2457–2461
    1. Bevilacqua PC, Brown TS, Chadalavada D, Lecomte J, Moody E, Nakano SI 2005. Linkage between proton binding and folding in RNA: Implications for RNA catalysis. Biochem Soc Trans 33: 466–470 - PubMed
    1. Boots JL, Canny MD, Azimi E, Pardi A 2008. Metal ion specificities for folding and cleavage activity in the Schistosoma hammerhead ribozyme. RNA 14: 2212–2222 - PMC - PubMed
    1. Brahms J, Maurizot JC, Michelson AM 1967. Conformational stability of dinucleotides in solution. J Mol Biol 25: 481–495 - PubMed

Publication types

LinkOut - more resources