

Distinct β-cell defects in impaired fasting glucose and impaired glucose tolerance
- PMID: 22275086
- PMCID: PMC3266412
- DOI: 10.2337/db11-0995
Distinct β-cell defects in impaired fasting glucose and impaired glucose tolerance
Abstract
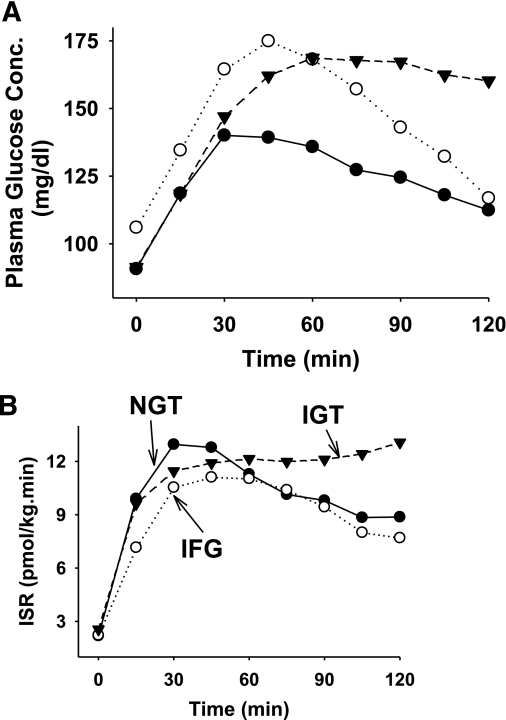
To characterize the defects in β-cell function in subjects with impaired fasting glucose (IFG) and compare the results to impaired glucose tolerance (IGT) and normal glucose tolerance (NGT) subjects, β-cell glucose sensitivity and rate sensitivity during the oral glucose tolerance test were measured with the model by Mari in 172 Mexican Americans. A subgroup (n=70) received a 2-h hyperglycemic clamp (+125 mg/dL), and first- and second-phase insulin secretion were quantitated. Compared with NGT, subjects with IFG and IGT manifested a decrease in β-cell glucose sensitivity; IFG subjects, but not IGT subjects, had decreased β-cell rate sensitivity. In IFG subjects, the defect in β-cell glucose sensitivity was time dependent, began to improve after 60 min, and was comparable to NGT after 90 min. The incremental area under the plasma C-peptide concentration curve during the first 12 min of the hyperglycemic clamp (ΔC-pep[AUC]0-12) was inversely related with the increase in FPG concentration (r=-36, r=0.001), whereas ΔC-pep[AUC]15-120 positively correlated with FPG concentration (r=0.29, r<0.05). When adjusted for the prevailing level of insulin resistance, first-phase insulin secretion was markedly decreased in both IFG and IGT, whereas second-phase insulin secretion was decreased only in IGT. These results demonstrate distinct defects in β-cell function in IFG and IGT.
Figures


Comment in
-
Prediabetes: evaluation of β-cell function.Diabetes. 2012 Feb;61(2):270-1. doi: 10.2337/db11-1677. Diabetes. 2012. PMID: 22275083 Free PMC article. No abstract available.
Similar articles
-
Impaired early- but not late-phase insulin secretion in subjects with impaired fasting glucose.Acta Diabetol. 2011 Sep;48(3):209-17. doi: 10.1007/s00592-011-0285-x. Epub 2011 May 8. Acta Diabetol. 2011. PMID: 21553243 Clinical Trial.
-
Differences in insulin action and secretion, plasma lipids and blood pressure levels between impaired fasting glucose and impaired glucose tolerance in Japanese subjects.Hypertens Res. 2008 Jul;31(7):1357-63. doi: 10.1291/hypres.31.1357. Hypertens Res. 2008. PMID: 18957806
-
[The relation between fasting plasma glucose concentrations and insulin resistance].Zhonghua Nei Ke Za Zhi. 2005 Oct;44(10):755-8. Zhonghua Nei Ke Za Zhi. 2005. PMID: 16255885 Chinese.
-
Impaired fasting glycaemia vs impaired glucose tolerance: similar impairment of pancreatic alpha and beta cell function but differential roles of incretin hormones and insulin action.Diabetologia. 2008 May;51(5):853-61. doi: 10.1007/s00125-008-0951-x. Epub 2008 Mar 4. Diabetologia. 2008. PMID: 18317726
-
Contributions of beta-cell dysfunction and insulin resistance to the pathogenesis of impaired glucose tolerance and impaired fasting glucose.Diabetes Care. 2006 May;29(5):1130-9. doi: 10.2337/diacare.2951130. Diabetes Care. 2006. PMID: 16644654 Review.
Cited by
-
Prediabetes: evaluation of β-cell function.Diabetes. 2012 Feb;61(2):270-1. doi: 10.2337/db11-1677. Diabetes. 2012. PMID: 22275083 Free PMC article. No abstract available.
-
Elevation of one hour plasma glucose during oral glucose tolerance testing.Pediatr Pulmonol. 2015 Oct;50(10):963-9. doi: 10.1002/ppul.23237. Epub 2015 Jun 18. Pediatr Pulmonol. 2015. PMID: 26087115 Free PMC article.
-
Sex-Specific Association Between Serum Zinc Concentration and Risk of Developing Type 2 Diabetes in Individuals with Isolated Impaired Fasting Glucose: A Prospective Cohort.Biol Trace Elem Res. 2025 Apr 7. doi: 10.1007/s12011-025-04609-x. Online ahead of print. Biol Trace Elem Res. 2025. PMID: 40193001
-
Dietary Interventions for the Prevention of Type 2 Diabetes in High-Risk Groups: Current State of Evidence and Future Research Needs.Nutrients. 2018 Sep 6;10(9):1245. doi: 10.3390/nu10091245. Nutrients. 2018. PMID: 30200572 Free PMC article. Review.
-
Impact of short-term exercise training intensity on β-cell function in older obese adults with prediabetes.J Appl Physiol (1985). 2018 Dec 1;125(6):1979-1986. doi: 10.1152/japplphysiol.00680.2018. Epub 2018 Oct 11. J Appl Physiol (1985). 2018. PMID: 30307821 Free PMC article. Clinical Trial.
References
-
- The Expert Committee on the Diagnosis and Classification of Diabetes Mellitus Report of the expert committee on the diagnosis and classification of diabetes mellitus. Diabetes Care 1997;20:1183–1197 - PubMed
-
- Gerstein HC, Santaguida P, Raina P, et al. Annual incidence and relative risk of diabetes in people with various categories of dysglycemia: a systematic overview and meta-analysis of prospective studies. Diabetes Res Clin Pract 2007;78:305–312 - PubMed
-
- Unwin N, Shaw J, Zimmet P, Alberti KGMM. Impaired glucose tolerance and impaired fasting glycaemia: the current status on definition and intervention. Diabet Med 2002;19:708–723 - PubMed
-
- Dankner R, Abdul-Ghani MA, Gerber Y, Chetrit A, Wainstein J, Raz I. Predicting the 20-year diabetes incidence rate. Diabetes Metab Res Rev 2007;23:551–558 - PubMed
-
- Shaw JE, Zimmet PZ, de Courten M, et al. Impaired fasting glucose or impaired glucose tolerance. What best predicts future diabetes in Mauritius? Diabetes Care 1999;22:399–402 - PubMed
Publication types
MeSH terms
Substances
Grants and funding
LinkOut - more resources
Full Text Sources
Medical
Miscellaneous
