. 2013 Mar;8(3):341-50.
doi: 10.1093/scan/nss002. Epub 2012 Jan 24.

Emotion regulation reduces loss aversion and decreases amygdala responses to losses

Affiliations

Emotion regulation reduces loss aversion and decreases amygdala responses to losses

Peter Sokol-Hessner et al. Soc Cogn Affect Neurosci. 2013 Mar.

Abstract

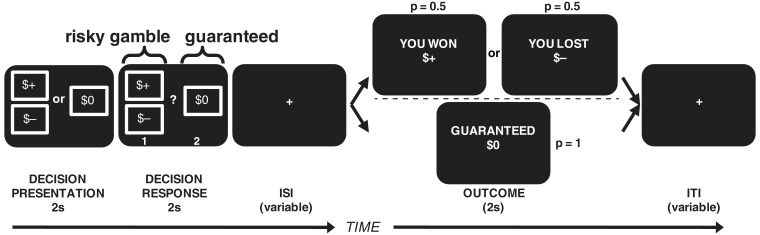
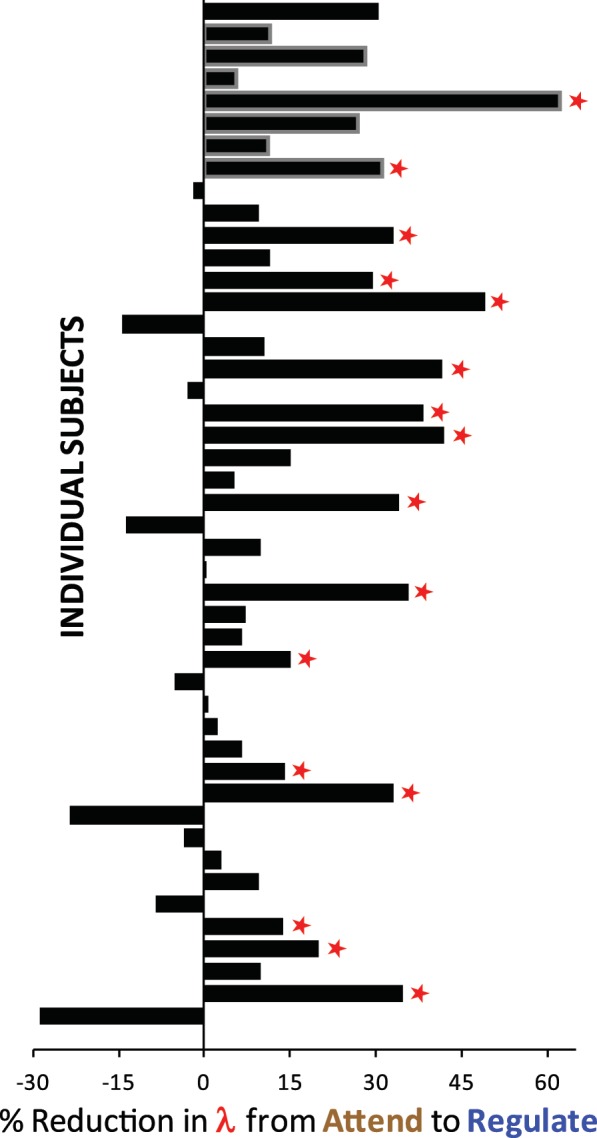
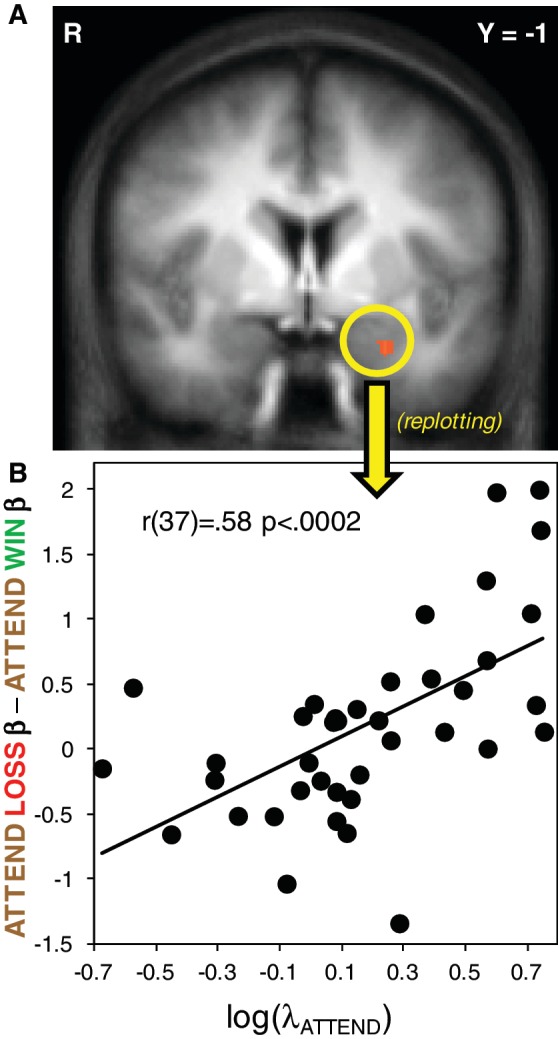
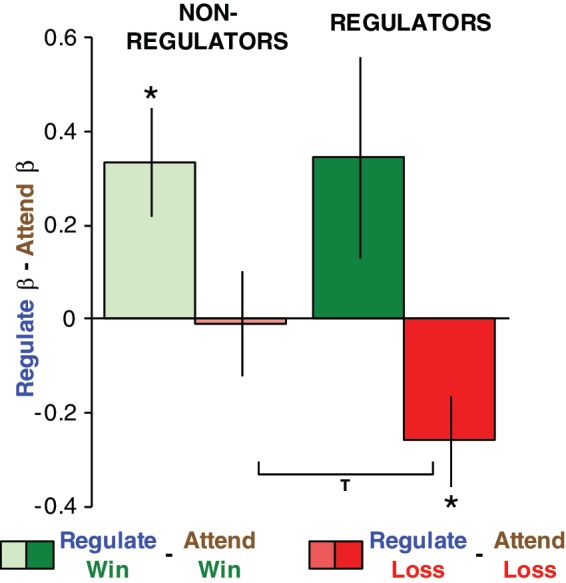
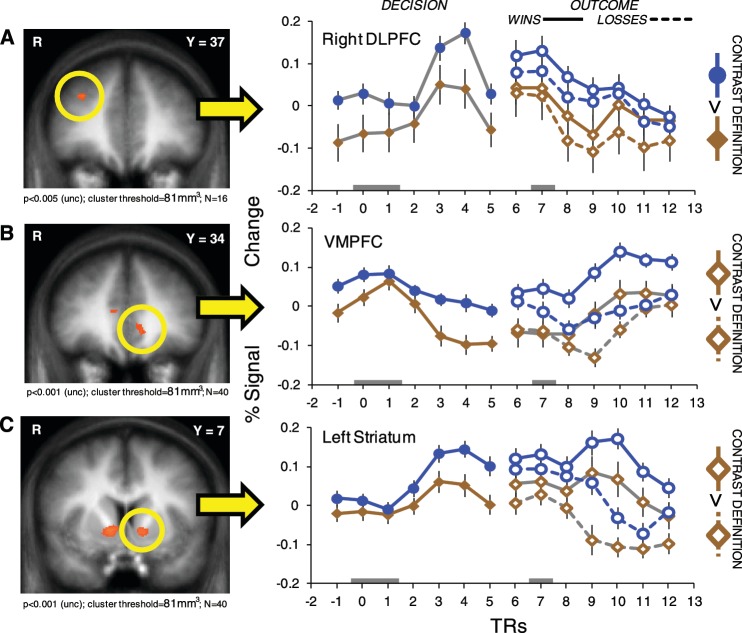
Emotion regulation strategies can alter behavioral and physiological responses to emotional stimuli and the neural correlates of those responses in regions such as the amygdala or striatum. The current study investigates the brain systems engaged when using an emotion regulation technique during financial decisions. In decision making, regulating emotion with reappraisal-focused strategies that encourage taking a different perspective has been shown to reduce loss aversion as observed both in choices and in the relative arousal responses to actual loss and gain outcomes. In the current study, we find using fMRI that behavioral loss aversion correlates with amygdala activity in response to losses relative to gains. Success in regulating loss aversion also correlates with the reduction in amygdala responses to losses but not to gains. Furthermore, across both decisions and outcomes, we find the reappraisal strategy increases baseline activity in dorsolateral and ventromedial prefrontal cortex and the striatum. The similarity of the neural circuitry observed to that seen in emotion regulation, despite divergent tasks, serves as further evidence for a role of emotion in decision making, and for the power of reappraisal to change assessments of value and thereby choices.


Figures

Fig. 1
Fig. 1
A schematic of the sequence of events for a full trial. Participants made a series of forced monetary choices between gambles (winning or losing with equal P = 0.5) and a guaranteed alternative (P = 1), with outcome screens following each choice. Symbols of ‘+’ and ‘−’ stand in for actual monetary amounts presented on each trial. After initial presentation of the gamble and the guaranteed amount (2 s; 1TR), the appearance of button cues indicated a response period (2 s) during which participants could either accept the gamble or reject it for the guaranteed alternative. After a poisson-distributed variable interstimulus interval (ISI; 2–8 s, mean 4.1 s), the outcome screen was presented (2 s) consisting of a win or lose screen with equal probability if the gamble had been accepted, otherwise the guaranteed alternative if the gamble had been rejected. Finally, a poisson-distributed variable intertrial interval (ITI; 4–12 s, mean 6.4 s) separated each trial from the next.
Fig. 2
Fig. 2
Regulation reduced loss aversion. Percent reduction in behavioral estimates of individuals’ loss aversion from ‘Attend’ to ‘Regulate’ (100 × (λATTENDλREGULATE)/ λATTEND). A positive number indicates less loss aversion in the ‘Regulate’ condition. Bars outlined in gray were subjects excluded from the analysis of outcomes (see Experimental Procedures: Participants). Red stars indicate individuals whose shift in loss aversion was individually significant at the P < 0.05 level. Participants are descendingly ordered by loss aversion, with the most loss averse at the top, and the least loss averse at the bottom.
Fig. 3
Fig. 3
Whole-brain correlation between loss aversion and outcome activity. (A) Whole-brain voxelwise correlation between individuals’ estimated λATTEND and the contrast values for ‘Attend’ Loss − ‘Attend’ Win. Map thresholded at P < 0.005, voxel extent threshold = 81 mm3; (B) Replotting of the correlation for illustration only.
Fig. 4
Fig. 4
Successful regulators reduce amygdala responses to loss outcomes. β estimates are extracted from the left amygdala region identified in Figure 3 and Table 1. Y-axis is the β estimate in ‘Regulate’ minus that in ‘Attend’ for either wins (greens) or losses (reds). Positive numbers indicate increased activity in ‘Regulate’, negative numbers indicate reduced activity in ‘Regulate’. Asterisks indicate significantly different from zero at P < 0.05. “T” indicates a significant group difference (one-tailed two-sample unequal variance t-test, P = 0.05).
Fig. 5
Fig. 5
Trial-triggered averages for activity in (A) right DLPFC, (B) VMPFC and (C) left striatum. Brown diamonds represent ‘Attend’ activity, and blue circles represent ‘Regulate’ activity. Decision activity is indicated with filled-in markers, outcome activity with outlined markers, and wins and losses with solid and dotted lines, respectively. The contrasts used to define the ROIs are indicated on the right, and their respective lines are plotted in gray on the graph. Decision activity is locked to the time of decision presentation (TRs 0 and 1, indicated by gray block on X-axis). Outcome activity is locked to the presentation of the outcome (labeled TR 7 on the graph, indicated by gray block on X-axis). Error bars are standard error of the mean

References

    1. Amaral DB, Price JL, Pitkanen A, Carmichael ST. Anatomical organization of the primate amygdaloid complex. In: Aggleton JP, editor. The Amygdala: Neurobiological Aspects of Emotion, Memory, and Mental Dysfunction. New York: Wiley-Liss; 1992. pp. 1–66.
    1. Andrade EB, Ariely D. The enduring impact of transient emotions on decision making. Organizational Behavior And Human Decision Processes. 2009;109(1):1–8.
    1. Avnet T, Higgins ET. How regulatory fit affects value in consumer choices and opinions. Journal of Marketing Research. 2006;43(1):1–10.
    1. Badre D, D'Esposito M. Functional magnetic resonance imaging evidence for a hierarchical organization of the prefrontal cortex. Journal of Cognitive Neuroscience. 2007;19(12):2082–99. - PubMed
    1. Banks SJ, Eddy KT, Angstadt M, Nathan PJ, Phan KL. Amygdala-frontal connectivity during emotion regulation. Social Cognitive and Affective Neuroscience. 2007;2(4):303–12. - PMC - PubMed

Publication types