

3-Dimensional morphometric analysis of murine bladder development and dysmorphogenesis
- PMID: 22275180
- PMCID: PMC3288201
- DOI: 10.1002/dvdy.23744
3-Dimensional morphometric analysis of murine bladder development and dysmorphogenesis
Abstract
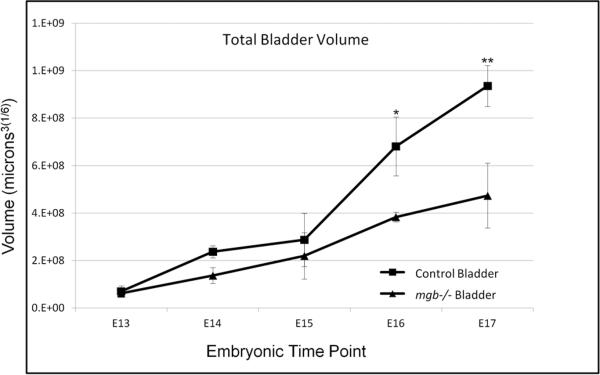
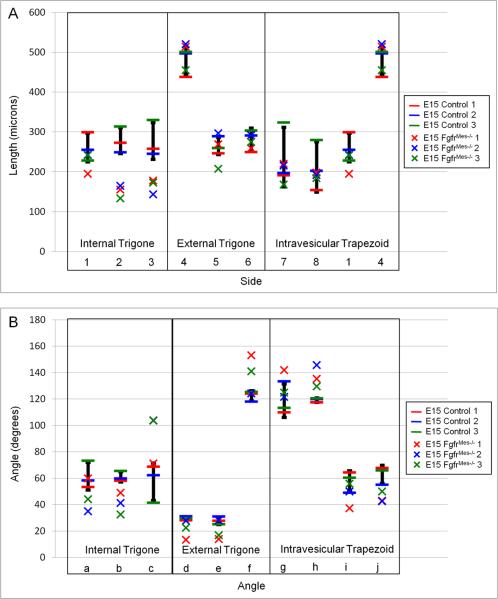
Background: Disorders of the urinary tract represent a major cause of morbidity and impaired quality of life. To better understand the morphological events responsible for normal urinary tract development, we performed 3-D reconstructive analysis of developing mouse bladders in control, mgb-/-, and Fgfr2(Mes-/-) mice.
Results: Detrusor smooth muscle differentiation initiated in the bladder dome and progressed caudally with the leading edge extending down the right posterior surface of the bladder. Gender-specific differences in detrusor smooth muscle development were observed during early embryonic development. Bladder trigone morphology transitioned from an isosceles to equilateral triangle during development due to the preferential lengthening of the urethra to ureter distance. The primary defect observed in mgb-/- bladders was a significant reduction in detrusor smooth muscle differentiation throughout development. Deviations from normal trigone morphology correlated best with VUR development in Fgfr2(Mes-/-) mice, while alterations in intravesicular tunnel length did not.
Conclusions: Multivariate morphometric analysis provides a powerful tool to quantify and assess urinary tract development.
Copyright © 2012 Wiley Periodicals, Inc.
Figures


Similar articles
-
Fgfr2 is integral for bladder mesenchyme patterning and function.Am J Physiol Renal Physiol. 2015 Apr 15;308(8):F888-98. doi: 10.1152/ajprenal.00624.2014. Epub 2015 Feb 4. Am J Physiol Renal Physiol. 2015. Retraction in: Am J Physiol Renal Physiol. 2016 Jul 1;311(1):F239. doi: 10.1152/ajprenal.zh2-7964-retr.2016. PMID: 25656370 Free PMC article. Retracted.
-
Fgfr2 is integral for bladder mesenchyme patterning and function.Am J Physiol Renal Physiol. 2017 Apr 1;312(4):F607-F618. doi: 10.1152/ajprenal.00463.2016. Epub 2017 Jan 4. Am J Physiol Renal Physiol. 2017. PMID: 28052872 Free PMC article.
-
Transcriptional profiling of the megabladder mouse: a unique model of bladder dysmorphogenesis.Dev Dyn. 2008 Jan;237(1):170-86. doi: 10.1002/dvdy.21391. Dev Dyn. 2008. PMID: 18069694
-
Smooth muscle differentiation and patterning in the urinary bladder.Differentiation. 2010 Sep-Oct;80(2-3):106-17. doi: 10.1016/j.diff.2010.05.004. Epub 2010 Jun 12. Differentiation. 2010. PMID: 20541860 Free PMC article. Review.
-
Mesenchymal-epithelial interactions in the bladder.World J Urol. 1996;14(5):301-9. doi: 10.1007/BF00184602. World J Urol. 1996. PMID: 8912470 Review.
Cited by
-
An illustrated anatomical ontology of the developing mouse lower urogenital tract.Development. 2015 May 15;142(10):1893-908. doi: 10.1242/dev.117903. Epub 2015 May 12. Development. 2015. PMID: 25968320 Free PMC article.
-
Guinea pig ciliary muscle development.Optom Vis Sci. 2014 Jul;91(7):730-9. doi: 10.1097/OPX.0000000000000304. Optom Vis Sci. 2014. PMID: 24901488 Free PMC article.
-
Spatiotemporal mapping of sensory and motor innervation of the embryonic and postnatal mouse urinary bladder.Dev Biol. 2021 Aug;476:18-32. doi: 10.1016/j.ydbio.2021.03.008. Epub 2021 Mar 17. Dev Biol. 2021. PMID: 33744254 Free PMC article.
-
A Feasibility Study to Determine Whether Clinical Contrast Enhanced Magnetic Resonance Imaging can Detect Increased Bladder Permeability in Patients with Interstitial Cystitis.J Urol. 2016 Mar;195(3):631-8. doi: 10.1016/j.juro.2015.08.077. Epub 2015 Aug 22. J Urol. 2016. PMID: 26307161 Free PMC article.
-
Uroplakin 1b is critical in urinary tract development and urothelial differentiation and homeostasis.Kidney Int. 2016 Mar;89(3):612-24. doi: 10.1016/j.kint.2015.11.017. Epub 2015 Dec 23. Kidney Int. 2016. PMID: 26880456 Free PMC article.
References
-
- Airik R, Kispert A. Down the tube of obstructive nephropathies: the importance of tissue interactions during ureter development. Kidney Int. 2007;72:1459–1467. - PubMed
-
- Airik R, Trowe MO, Foik A, Farin HF, Petry M, Schuster-Gossler K, Schweizer M, Scherer G, Kist R, Kispert A. Hydroureteronephrosis due to loss of Sox9-regulated smooth muscle cell differentiation of the ureteric mesenchyme. Hum Mol Genet. 2010;19:4918–4929. - PubMed
-
- Atiyeh B, Husmann D, Baum M. Contralateral renal abnormalities in multicystic-dyspplastic kidney disease. J Pediatr. 1992;121:65–67. - PubMed
-
- Batourina E, Tsai S, Lambert S, Sprenkle P, Viana R, Dutta S, Hensle T, Wang F, Niederreither K, McMahon A, Carrol T, Mendelsohn C. Apoptosis induced by vitamin A signaling is crucial for connecting ureters to the bladder. Nat Genet. 2005;37:1082–1089. - PubMed
Publication types
MeSH terms
Substances
Grants and funding
LinkOut - more resources
Full Text Sources
Molecular Biology Databases
Miscellaneous
