. 2012 Mar 30;287(14):11070-81.
doi: 10.1074/jbc.M111.302547. Epub 2012 Jan 24.

Critical role of O-Linked β-N-acetylglucosamine transferase in prostate cancer invasion, angiogenesis, and metastasis

Affiliations

Critical role of O-Linked β-N-acetylglucosamine transferase in prostate cancer invasion, angiogenesis, and metastasis

Thomas P Lynch et al. J Biol Chem. .

Abstract

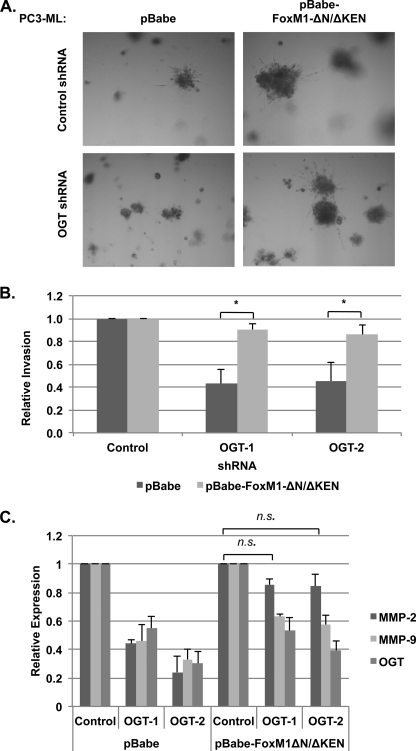
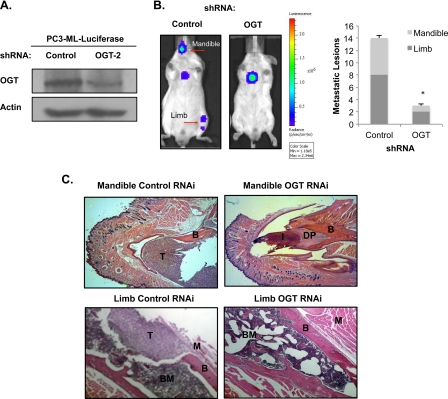
Cancer cells universally increase glucose and glutamine consumption, leading to the altered metabolic state known as the Warburg effect; one metabolic pathway, highly dependent on glucose and glutamine, is the hexosamine biosynthetic pathway. Increased flux through the hexosamine biosynthetic pathway leads to increases in the post-translational addition of O-linked β-N-acetylglucosamine (O-GlcNAc) to various nuclear and cytosolic proteins. A number of these target proteins are implicated in cancer, and recently, O-GlcNAcylation was shown to play a role in breast cancer; however, O-GlcNAcylation in other cancers remains poorly defined. Here, we show that O-GlcNAc transferase (OGT) is overexpressed in prostate cancer compared with normal prostate epithelium and that OGT protein and O-GlcNAc levels are elevated in prostate carcinoma cell lines. Reducing O-GlcNAcylation in PC3-ML cells was associated with reduced expression of matrix metalloproteinase (MMP)-2, MMP-9, and VEGF, resulting in inhibition of invasion and angiogenesis. OGT-mediated regulation of invasion and angiogenesis was dependent upon regulation of the oncogenic transcription factor FoxM1, a key regulator of invasion and angiogenesis, as reducing OGT expression led to increased FoxM1 protein degradation. Conversely, overexpression of a degradation-resistant FoxM1 mutant abrogated OGT RNAi-mediated effects on invasion, MMP levels, angiogenesis, and VEGF expression. Using a mouse model of metastasis, we found that reduction of OGT expression blocked bone metastasis. Altogether, these data suggest that as prostate cancer cells alter glucose and glutamine levels, O-GlcNAc modifications and OGT levels become elevated and are required for regulation of malignant properties, implicating OGT as a novel therapeutic target in the treatment of cancer.


Figures

FIGURE 1.
FIGURE 1.
OGT is overexpressed in prostate carcinoma. A, OGT expression data from normal prostate tissue (n = 17), normal prostate tissue adjacent to tumor (n = 64), primary prostate cancer tumor tissue (n = 65), and metastatic prostate cancer tumor tissue (n = 25) available through the National Center for Biotechnology Information Gene Expression Omnibus (NCBI GEO accession number GDS2545) graphed as average expression (error bars indicate S.E.) for the indicated tissue type, with the best fit line fitted to a plot (r2 = 0.99627). B, OGT expression data mined from the OncomineTM Database (27), segregated into high or low expression profiles and correlated with follow-up patient survival data. Prostate cancer patients having a low OGT expression profile (OGT less than the average of sample population) associate with high disease-free prognosis up to 5 years post-therapy, whereas patients having a high OGT expression profile (OGT more than the average of sample population) associate with persistence of disease post-therapy. C, normal prostate cell lines RWPE-1 and NPTX-1532 and prostate cancer cell lines PC3, PC3-ML, and DU145 were lysed and subjected to immunoblotting with the indicated antibodies. OGA, O-GlcNAcase. D, total RNA was collected from RWPE-1 and PC3-ML cells and then subjected to qRT-PCR for OGT expression. Error bars indicate S.E. for n = 3. *, p ≤ 0.01. A.U., arbitrary units.
FIGURE 2.
FIGURE 2.
Targeting OGT decreases malignant growth and proliferation in vitro. A, PC3-ML cells stably expressing control, OGT-1, or OGT-2 shRNA were lysed and immunoblotted with the indicated antibodies. B, PC3-ML cells stably expressing control or OGT shRNA were seeded on a bed of Matrigel, overlaid with dilute Matrigel in three-dimension culture medium, and assayed for proliferation as measured by cells/well (depicted graphically). Data are expressed as average cells/well; error bars indicate S.E. for n = 3. *, p < 0.05. C, PC3-ML cells described in A were stained with propidium iodide for cell cycle analysis. Data are presented as percentage of the gated population in the indicated phase; error bars indicate S.E. for n = 3. *, p < 0.05. D, PC3-ML cells stably expressing control, OGT-1, or OGT-2 shRNA were incubated with FITC-conjugated antibodies against Ki-67 or an isotype control and analyzed by flow cytometry. Data are presented as percentage of the gated population positive for Ki-67; error bars indicate S.E. for n = 3. *, < 0.01.
FIGURE 3.
FIGURE 3.
Targeting OGT decreases invasive phenotypes in vitro. A, bright-field (upper panels) and confocal (lower panels) micrographs comparing control, OGT-1, and OGT-2 shRNA-expressing PC3-ML cells maintained in three-dimensional culture systems over 12 days. Actin, integrin α6, and DAPI are shown in the confocal images. B, PC3-ML cells expressing control, OGT-1, or OGT-2 shRNA were assayed for ability to invade through Matrigel-coated Transwell membranes. Data are presented as relative invasion compared with control shRNA; error bars indicate S.E. for n = 3. *, < 0.05. C, total RNA was collected from PC3-ML cells expressing control, OGT-1, or OGT-2 shRNA and subjected to qRT-PCR for MMP-2, MMP-9, and OGT. Data were normalized to cyclophilin A and are presented as relative expression compared with control shRNA; error bars indicate S.E. for n = 3. *, < 0.05. D, PC3-ML cells described in B were lysed and immunoblotted with the indicated antibodies.
FIGURE 4.
FIGURE 4.
Targeting OGT decreases angiogenic potential in vitro. A, conditioned RPMI 1640 medium from control, OGT-1, or OGT-2 shRNA-expressing PC3-ML cells was used to overlay HUVECs seeded on a bed of Matrigel for 6 h in endothelial cell tube formation assays. Relative tube length to control shRNA was calculated; error bars indicate S.E. for n = 3. *, p < 0.05. Representative images are depicted above. B, total RNA was collected from PC3-ML cells expressing control, OGT-1, or OGT-2 shRNA and subjected to qRT-PCR for VEGF and OGT. Data were normalized to cyclophilin A and are presented as relative expression compared with control shRNA; error bars indicate S.E. for n = 3. *, < 0.05. A.U., arbitrary units. C, PC3-ML cells described in B were lysed and immunoblotted with the indicated antibodies.
FIGURE 5.
FIGURE 5.
Expression of non-degradable FoxM1 mutant (FoxM1-ΔN/ΔKEN) partially rescues angiogenic potential of OGT shRNA-expressing PC3-ML cells. A, PC3-ML cells stably expressing control or OGT shRNA were treated with lactacystin (100 μm) for 6 h. Lysates were collected and analyzed by immunoblotting with the indicated antibodies. B, OGT was targeted in PC3-ML cells stably expressing a vector control (pBabe) or a FoxM1 mutant (pBabe-FoxM1-ΔN/ΔKEN), and cells were subsequently lysed and immunoblotted with the indicated antibodies. Endogenous FoxM1 (*) and mutant FoxM1 (**) are indicated. C, conditioned RPMI 1640 medium from control, OGT-1, or OGT-2 shRNA-expressing PC3-ML-pBabe or PC3-ML-pBabe-FoxM1-ΔN/ΔKEN cells was used to overlay HUVECs seeded on a bed of Matrigel as described in the legend to Fig. 4A. Relative tube length to control shRNA was calculated; error bars indicate S.E. for n = 3. *, < 0.05. Representative images are depicted above. D, total RNA was collected from PC3-ML-pBabe and PC3-ML-pBabe-FoxM1-ΔN/ΔKEN cells expressing control, OGT-1, or OGT-2 shRNA and subjected to qRT-PCR for VEGF and OGT. Data were normalized to cyclophilin A and are presented as relative expression compared with the respective control shRNA; error bars indicate S.E. for n = 3. *, < 0.05.
FIGURE 6.
FIGURE 6.
Expression of non-degradable FoxM1 mutant (FoxM1-ΔN/ΔKEN) partially rescues invasive capacity of OGT shRNA-expressing PC3-ML cells. A, representative bright-field micrographs comparing day 12 control, OGT-1, or OGT-2 shRNA-expressing PC3-ML-pBabe or PC3-ML-pBabe-FoxM1-ΔN/ΔKEN cells maintained in three-dimensional culture systems. B, PC3-ML cells as described in A were subjected to Transwell invasion assays. Error bars indicate S.E. for n = 3. *, < 0.05. C, PC3-ML cells as described in A were subjected qRT-PCR for MMP-2, MMP-9, and OGT and normalized to the respective control. Error bars indicate S.E. for n = 3. n.s., not significant.
FIGURE 7.
FIGURE 7.
OGT depletion inhibits prostate cancer bone metastasis. A, PC3-ML cells stably expressing either control or OGT-2 shRNA were lysed and immunoblotted with the indicated antibodies prior to being injected intracardially into 6-week-old male severe combined immunodeficient mice. B, reduction of OGT inhibits prostate cancer metastatic lesions to mandibles and limbs. Animals were imaged using the IVIS Lumina system at 5 weeks post-injection with control and OGT-2 shRNA-expressing PC3-ML cells. The red arrows indicates metastatic foci to mandibles or limbs. Metastatic foci were counted for control (n = 9) and OGT-2 (n = 8) shRNA mice and graphed. Error bars indicate S.E. *, < 0.05 (right). C, representative images (magnification ×4) from immunohistochemistry analysis (hematoxylin/eosin) of mandibles (upper panels) and limbs (lower panels) from mice injected with control or OGT RNAi-expressing PC3-ML cells. T, tumor; I, incisor; DP, dental pulp; B, bone; BM, bone marrow; M, muscle.

Similar articles

Cited by

References

    1. Dang C. V., Semenza G. L. (1999) Oncogenic alterations of metabolism. Trends Biochem. Sci. 24, 68–72 - PubMed
    1. Warburg O. (1956) On the origin of cancer cells. Science 123, 309–314 - PubMed
    1. Deberardinis R. J., Sayed N., Ditsworth D., Thompson C. B. (2008) Brick by brick: metabolism and tumor cell growth. Curr. Opin. Genet. Dev. 18, 54–61 - PMC - PubMed
    1. Kim J. W., Dang C. V. (2006) Cancer's molecular sweet tooth and the Warburg effect. Cancer Res. 66, 8927–8930 - PubMed
    1. Gatenby R. A. (1995) Models of tumor-host interaction as competing populations: implications for tumor biology and treatment. J. Theor. Biol. 176, 447–455 - PubMed

Publication types

MeSH terms

Substances