. 2012 Mar 23;287(13):10277-10288.
doi: 10.1074/jbc.M111.317453. Epub 2012 Jan 24.

Hepatocyte-specific deletion of Janus kinase 2 (JAK2) protects against diet-induced steatohepatitis and glucose intolerance

Affiliations

Hepatocyte-specific deletion of Janus kinase 2 (JAK2) protects against diet-induced steatohepatitis and glucose intolerance

Sally Yu Shi et al. J Biol Chem. .

Abstract

Non-alcoholic fatty liver disease (NAFLD) is becoming the leading cause of chronic liver disease and is now considered to be the hepatic manifestation of the metabolic syndrome. However, the role of steatosis per se and the precise factors required in the progression to steatohepatitis or insulin resistance remain elusive. The JAK-STAT pathway is critical in mediating signaling of a wide variety of cytokines and growth factors. Mice with hepatocyte-specific deletion of Janus kinase 2 (L-JAK2 KO mice) develop spontaneous steatosis as early as 2 weeks of age. In this study, we investigated the metabolic consequences of jak2 deletion in response to diet-induced metabolic stress. To our surprise, despite the profound hepatosteatosis, deletion of hepatic jak2 did not sensitize the liver to accelerated inflammatory injury on a prolonged high fat diet (HFD). This was accompanied by complete protection against HFD-induced whole-body insulin resistance and glucose intolerance. Improved glucose-stimulated insulin secretion and an increase in β-cell mass were also present in these mice. Moreover, L-JAK2 KO mice had progressively reduced adiposity in association with blunted hepatic growth hormone signaling. These mice also exhibited increased resting energy expenditure on both chow and high fat diet. In conclusion, our findings indicate a key role of hepatic JAK2 in metabolism such that its absence completely arrests steatohepatitis development and confers protection against diet-induced systemic insulin resistance and glucose intolerance.


Figures
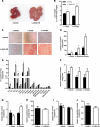
FIGURE 1.
FIGURE 1.
Progressive hepatic steatosis in L-JAK2 KO mice. A, representative photographs of liver lobes harvested from 12-week-old mice. B, liver weight normalized to total body weight in L-JAK2 KO mice and littermate controls (n ≥ 6 per group). C, representative photographs of Oil-Red-O staining of liver sections from mice at 2 weeks, 1 month, and 4 months of age after 16 h of fasting. Scale bar: 200 μm. D, hepatic TG content at 1, 4, and 6 months of age. Results are normalized to tissue weight. (n = 3–8 per group). E, extracted TG from livers of 6-month-old mice was converted to FA methyl esters and fatty acid composition was analyzed with a gas chromatography system (n = 3–4 per group). AA: arachidonic acid; EPA: eicosapentaenoic acid; DHA: docosahexaenoic acid. F, hepatic cholesterol content at 1, 4, and 6 months of age, represented as mg total cholesterol per gram of liver tissue (n = 3–6 per group). G, hepatic DAG content at 1 (n = 8) and 6 (n = 4) months of age. H, hepatic ceramide content at 1 month of age (n = 7). I, hepatic total FFA content at 1 (n = 8) and 6 (n = 4) months of age. J, hepatic free palmitate content at 1 month of age (n = 5 per group), normalized to liver tissue weight. Results are mean ± S.E. *, p < 0.05; **, p < 0.01; ***, p < 0.001.
FIGURE 2.
FIGURE 2.
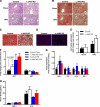
No progression to steatohepatitis on a HFD in L-JAK2 KO mice. A and B, representative photographs of (A) hematoxylin and eosin, and (B) Masson's trichrome staining of liver sections from 4-month-old L-JAK2 KO mice and control littermates after 8–10 weeks on a standard chow or HFD (original magnification ×25). C, representative photographs of Masson's trichrome staining of liver sections from 11-month-old chow-fed mice (original magnification ×25). D, immunofluorescent staining of macrophages (in red) in livers from 4-month-old chow-fed mice using anti-F4/80 antibody (original magnification ×20). E, quantitative RT-PCR analysis of mRNA expression of emr1 (F4/80) in livers from chow- and HFD-fed mice (n ≥ 5 per group). Values are normalized to 18S mRNA levels and expressed as fold changes relative to the chow control group. F, serum levels of ALT and AST in chow- and HFD-fed mice (n ≥ 5 per group). Values are expressed as fold change over the chow control group. G, mRNA expression of genes encoding inflammatory markers in livers from chow- and HFD-fed mice (n ≥ 8 per group). Values are normalized to 18S mRNA levels and expressed as fold changes relative to the chow control group. tnf-α, tumor necrosis factor α; il-6, interleukin-6; il-1β, interleukin-1β; ifn-γ, interferon γ. H, serum levels of TNF-α and IL-6 in chow- and HFD-fed mice (n ≥ 5 per group). Results are mean ± S.E. *, p < 0.05 versus control littermates.
FIGURE 3.
FIGURE 3.
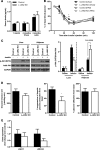
Attenuated hepatic insulin sensitivity but normal systemic insulin sensitivity in L-JAK2 KO mice. A, fasting serum insulin levels. B, results of intraperitoneal insulin (1.5 units/kg) tolerance test in chow- and HFD-fed mice (n ≥ 5 per group). ##, p < 0.01 Control HFD versus L-JAK2 KO HFD; and †, p < 0.05 Control Chow versus Control HFD. C, liver and subcutaneous fat lysates were prepared from L-JAK2 KO mice and control littermates 10 min after an intraperitoneal injection of insulin (5 units/kg) or saline and resolved by SDS-PAGE. Lysates were immunoblotted with anti-phospho-Akt (S473), total Akt, or anti-GAPDH antibodies. Protein band intensity was quantified by ImageJ software, and expression level of p-Akt is normalized to that of total Akt (n = 3 per group). D, steady-state glucose infusion rate, suppression of hepatic glucose production and glucose utilization measured during hyperinsulinemic-euglycemic clamps in 4-month-old chow-fed mice (n = 5 per group). E, mRNA expression of gluconeogenic genes, pepck and g6pase (n = 7 per group), in livers from overnight fasted L-JAK2 KO mice and littermate controls. Values are normalized to 18s mRNA levels and expressed as fold changes relative to control. Pepck, phosphoenolpyruvate carboxykinase; g6pase, glucose-6-phosphatase. Results are mean ± S.E. *, p < 0.05.
FIGURE 4.
FIGURE 4.
L-JAK2 KO mice are protected from glucose intolerance. A, fasting and B, random blood glucose at 1 (n = 17–21) and 6 (n = 4–8) months of age. C, results of intraperitoneal glucose (1 g/kg) tolerance test (n ≥ 8). *, p < 0.05; ***, p < 0.001 Control Chow versus L-JAK2 KO Chow; #, p < 0.05; ###, p < 0.001 Control HFD versus L-JAK2 KO HFD; and †, p < 0.05; ††, p < 0.01; †††, p < 0.001 Control Chow versus Control HFD. D, serum insulin levels in response to an intraperitoneal injection of 3 g/kg glucose. Values are expressed as fold change over the control group (n ≥ 5). E, representative photographs of pancreatic sections stained with anti-insulin antibody (original magnification ×10). Arrowheads point to pancreatic islets. F, quantification of β-cell area from pancreatic sections stained for insulin in E, expressed as percent of total pancreatic area (n ≥ 7). Results are mean ± S.E. *, p < 0.05; **, p < 0.01; ***, p < 0.001.
FIGURE 5.
FIGURE 5.
L-JAK2 KO mice exhibit impaired hepatic GH signaling. A and B, serum levels of (A) insulin-like growth factor 1 (IGF-1) and (B) GH measured at 1 and 4 months of age (n ≥ 5 per group). C, liver lysates were prepared from 1-month-old L-JAK2 KO mice and littermate controls and resolved by SDS-PAGE. Lysates were immunoblotted with anti-phospho-STAT5, total STAT5, phospho-STAT3, total STAT3, or anti-GAPDH antibodies. Protein band intensity was quantified by ImageJ software, and levels of p-STAT5 (n = 3) and p-STAT3 (n = 7) are normalized to expression of total STAT5 and STAT3, respectively. D, mRNA expression of two STAT5-target genes, socs-3 (n = 3) and igf-1 (n ≥ 6 per group), in livers from L-JAK2 KO mice and littermate controls at 1 month of age. Values are normalized to 18S mRNA levels and expressed as fold changes relative to control. Socs-3, suppressor of cytokine signaling 3; igf-1, insulin-like growth factor 1. Results are mean ± S.E. *, p < 0.05; **, p < 0.01.
FIGURE 6.
FIGURE 6.
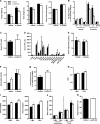
L-JAK2 KO mice display a reduction in adiposity and an increase in energy expenditure. A, body weight, body length measured from snout to anus, and body mass index at 1 (n = 6–16 per group) and 6 (n = 6–13 per group) months of age. B, visceral (perigonadal depot), subcutaneous (inguinal depot) and brown fat pads were harvested from 1- and 6-month-old mice and weighed (n = 7–10 per group). Results are expressed relative to total body weight. vis., visceral; s.c., subcutaneous. C, serum total FFA at 4 months of age (n ≥ 3 per group). D, serum levels of individual fatty acid species (n = 3 per group). E and F, serum levels of (E) adiponectin and (F) leptin from mice at 1 and 4 months of age (n ≥ 5 per group). G–J, chow-fed mice at 5–6 months of age were housed individually in metabolic chambers with free access to food and water and energy balance data were collected for 24 h (n = 9). G, RER, calculated as VCO2/VO2; H, oxygen consumption (VO2) and carbon dioxide production (VCO2); (I) daily food intake was determined by weighing the chow before and after the 24-h measurement. Results are expressed relative to total body weight; (J) physical activity, expressed as average number of infra-red beam breaks during one measurement interval. K, rectal temperature of chow-fed mice at 5–6 months of age measured at 10:00 AM. Results are mean ± S.E. *, p < 0.05; **, p < 0.01; ***, p < 0.001.
FIGURE 7.
FIGURE 7.
Proposed model of the mechanism for the observed phenotype in L-JAK2 KO mice. Deletion of JAK2 specifically in hepatocytes attenuates hepatic GH signaling, leading to lipid over-accumulation in the liver as a result of increased uptake of circulating free fatty acids. Impaired hepatic insulin signaling triggers compensatory β-cell proliferation in the pancreatic islets, leading to increased β-cell mass. Elevated GH levels may also promote compensatory β-cell proliferation in response to HFD, thereby protecting against HFD-induced glucose intolerance. Furthermore, GH may stimulate resting energy expenditure, leading to an improved metabolic profile compared with their control littermates. On the other hand, as an essential mediator of inflammatory signaling, deletion of JAK2 arrests the progression of steatosis to steatohepatitis.

References

    1. Angulo P. (2002) Nonalcoholic fatty liver disease. N. Engl. J. Med. 346, 1221–1231 - PubMed
    1. Szczepaniak L. S., Nurenberg P., Leonard D., Browning J. D., Reingold J. S., Grundy S., Hobbs H. H., Dobbins R. L. (2005) Magnetic resonance spectroscopy to measure hepatic triglyceride content: prevalence of hepatic steatosis in the general population. Am. J. Physiol. Endocrinol. Metab. 288, E462–468 - PubMed
    1. Marchesini G., Brizi M., Bianchi G., Tomassetti S., Bugianesi E., Lenzi M., McCullough A. J., Natale S., Forlani G., Melchionda N. (2001) Nonalcoholic fatty liver disease: a feature of the metabolic syndrome. Diabetes 50, 1844–1850 - PubMed
    1. Matteoni C. A., Younossi Z. M., Gramlich T., Boparai N., Liu Y. C., McCullough A. J. (1999) Nonalcoholic fatty liver disease: a spectrum of clinical and pathological severity. Gastroenterology 116, 1413–1419 - PubMed
    1. Younossi Z. M., Gramlich T., Liu Y. C., Matteoni C., Petrelli M., Goldblum J., Rybicki L., McCullough A. J. (1998) Nonalcoholic fatty liver disease: assessment of variability in pathologic interpretations. Mod. Pathol. 11, 560–565 - PubMed

Publication types

MeSH terms