

Slow updating of the achromatic point after a change in illumination
- PMID: 22275468
- PMCID: PMC4371580
- DOI: 10.1167/12.1.19
Slow updating of the achromatic point after a change in illumination
Abstract
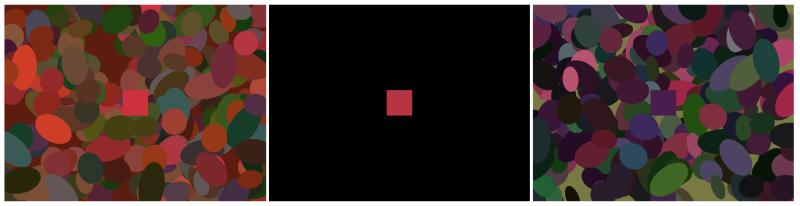
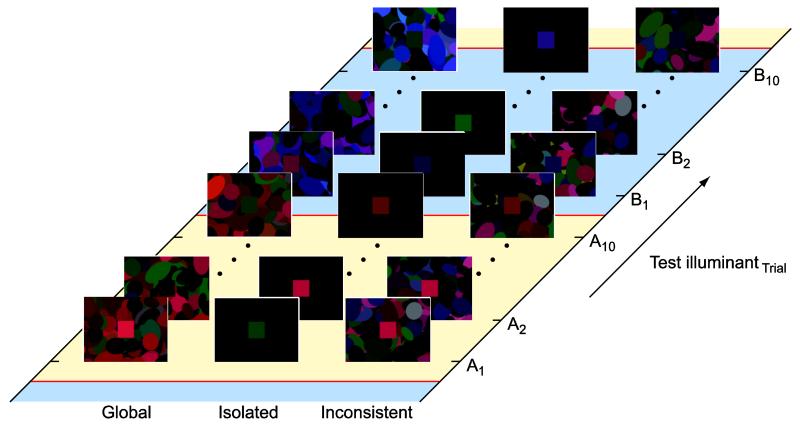
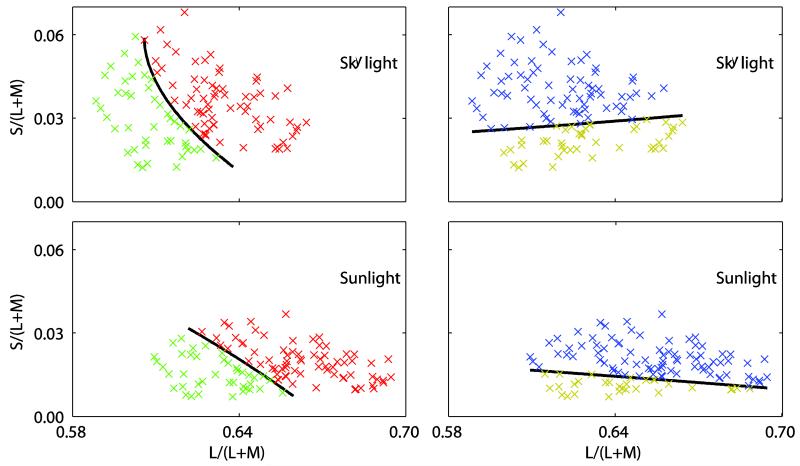
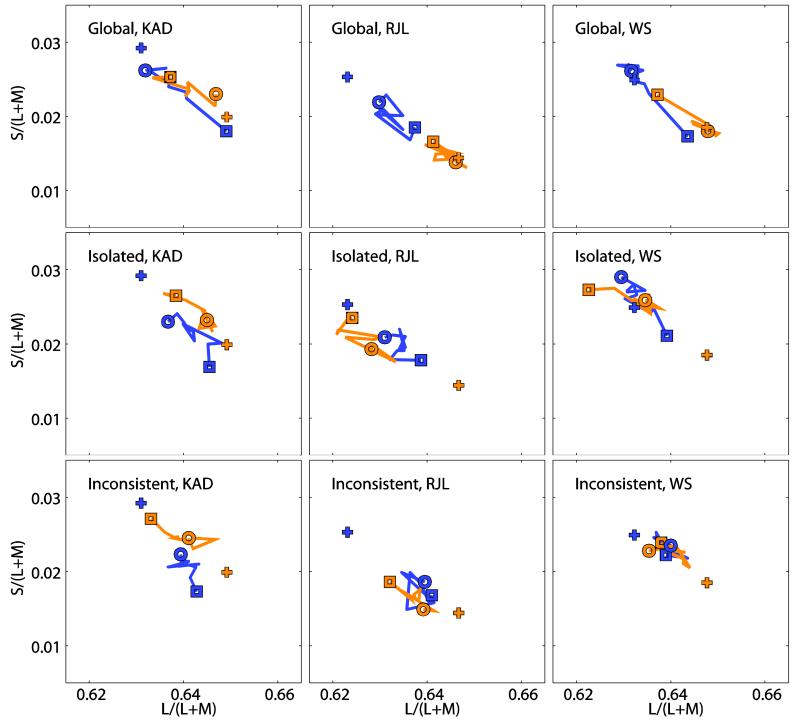
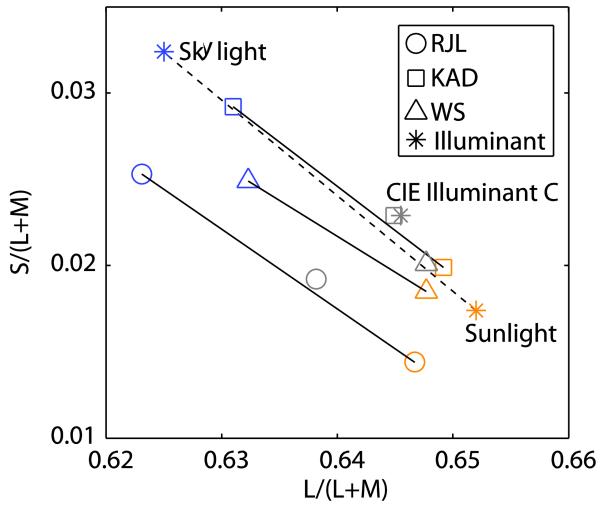
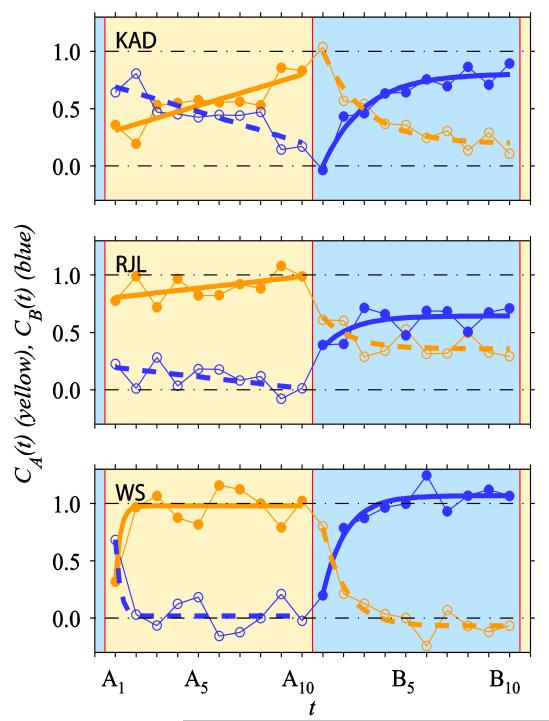
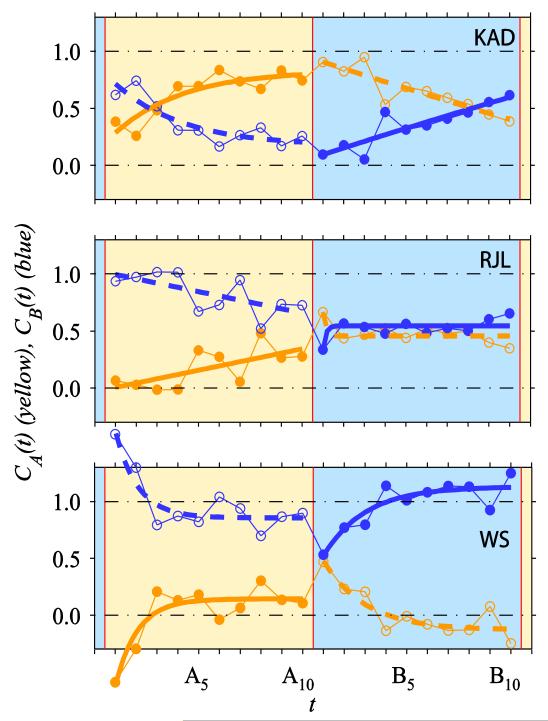
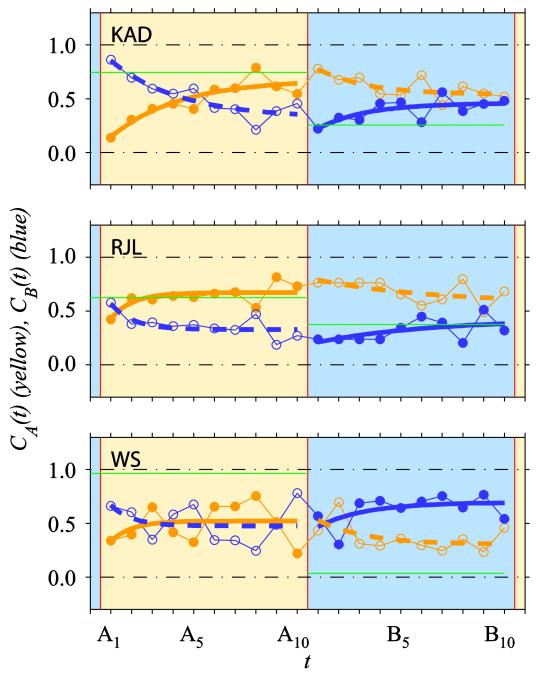
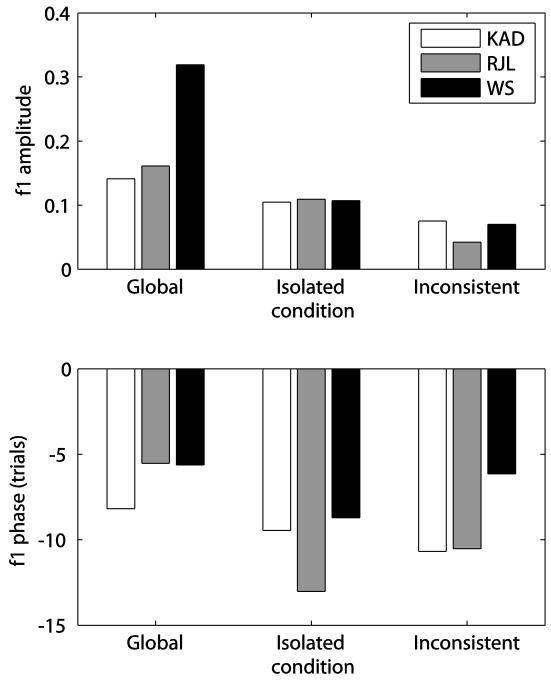
For a color constant observer, the color appearance of a surface is independent of the spectral composition of the light illuminating it. We ask how rapidly color appearance judgments are updated following a change in illumination. We obtained repeated binary color classifications for a set of stimuli defined by their reflectance functions and rendered under either sunlight or skylight. We used these classifications to derive boundaries in color space that identify the observer's achromatic point. In steady-state conditions of illumination, the achromatic point lay close to the illuminant chromaticity. In our experiment, the illuminant changed abruptly every 21 s (at the onset of every 10th trial), allowing us to track changes in the achromatic point that were caused by the cycle of illuminant changes. In one condition, the test reflectance was embedded in a spatial pattern of reflectance samples under consistent illumination. The achromatic point migrated across color space between the chromaticities of the steady-state achromatic points. This update took several trials rather than being immediate. To identify the factors that governed perceptual updating of appearance judgments, we used two further conditions, one in which the test reflectance was presented in isolation and one in which the surrounding reflectances were rendered under an inconsistent and unchanging illumination. Achromatic settings were not well predicted by the information available from scenes at a single time point. Instead, the achromatic points showed a strong dependence on the history of chromatic samples. The strength of this dependence differed between observers and was modulated by the spatial context.
Figures
Similar articles
-
The loci of achromatic points in a real environment under various illuminant chromaticities.Vision Res. 2006 Oct;46(19):3055-66. doi: 10.1016/j.visres.2006.03.012. Epub 2006 Jun 19. Vision Res. 2006. PMID: 16782168
-
Context-dependent judgments of color that might allow color constancy in scenes with multiple regions of illumination.J Opt Soc Am A Opt Image Sci Vis. 2012 Feb 1;29(2):A247-57. doi: 10.1364/JOSAA.29.00A247. J Opt Soc Am A Opt Image Sci Vis. 2012. PMID: 22330386 Free PMC article.
-
Color appearance: effects of illuminant changes under different surface collections.J Opt Soc Am A Opt Image Sci Vis. 1994 Feb;11(2):531-42. doi: 10.1364/josaa.11.000531. J Opt Soc Am A Opt Image Sci Vis. 1994. PMID: 8120699
-
Surface color perception and equivalent illumination models.J Vis. 2011 May 2;11(5):10.1167/11.5.1 1. doi: 10.1167/11.5.1. J Vis. 2011. PMID: 21536727 Free PMC article. Review.
-
Methods for Assessing Quantity and Quality of Illumination.Annu Rev Vis Sci. 2019 Sep 15;5:479-502. doi: 10.1146/annurev-vision-091718-015018. Epub 2019 Jun 21. Annu Rev Vis Sci. 2019. PMID: 31226013 Review.
Cited by
-
Temporal dynamics of daylight perception: Detection thresholds.J Vis. 2020 Dec 2;20(13):18. doi: 10.1167/jov.20.13.18. J Vis. 2020. PMID: 33372985 Free PMC article.
-
What is white?J Vis. 2015;15(16):5. doi: 10.1167/15.16.5. J Vis. 2015. PMID: 26641948 Free PMC article.
-
Low levels of specularity support operational color constancy, particularly when surface and illumination geometry can be inferred.J Opt Soc Am A Opt Image Sci Vis. 2016 Mar;33(3):A306-18. doi: 10.1364/JOSAA.33.00A306. J Opt Soc Am A Opt Image Sci Vis. 2016. PMID: 26974938 Free PMC article.
-
Chromatic adaptation from achromatic stimuli with implied color.Atten Percept Psychophys. 2019 Nov;81(8):2890-2901. doi: 10.3758/s13414-019-01716-5. Atten Percept Psychophys. 2019. PMID: 31201659 Free PMC article.
-
The achromatic locus: effect of navigation direction in color space.J Vis. 2014 Jan 24;14(1):25. doi: 10.1167/14.1.25. J Vis. 2014. PMID: 24464164 Free PMC article.
References
-
- Annan V, Gilchrist A. Lightness depends on immediately prior experience. Perception & Psychophysics. 2004;66(6):943–952. - PubMed
-
- Barbur JL, de Cunha D, Williams CB, Plant G. Study of instantaneous color constancy mechanisms in human vision. Journal of Electronic Imaging. 2004;13(1):15–28.
-
- Barbur JL, Spang K. Colour constancy and conscious perception of changes of illuminant. Neuropsychologia. 2008;46(3):853–863. - PubMed
Publication types
MeSH terms
Grants and funding
LinkOut - more resources
Full Text Sources
