. 2013 Jan;23(1):162-77.
doi: 10.1093/cercor/bhr392. Epub 2012 Jan 23.

Polysialylated NCAM and ephrinA/EphA regulate synaptic development of GABAergic interneurons in prefrontal cortex

Affiliations

Polysialylated NCAM and ephrinA/EphA regulate synaptic development of GABAergic interneurons in prefrontal cortex

Leann H Brennaman et al. Cereb Cortex. 2013 Jan.

Abstract

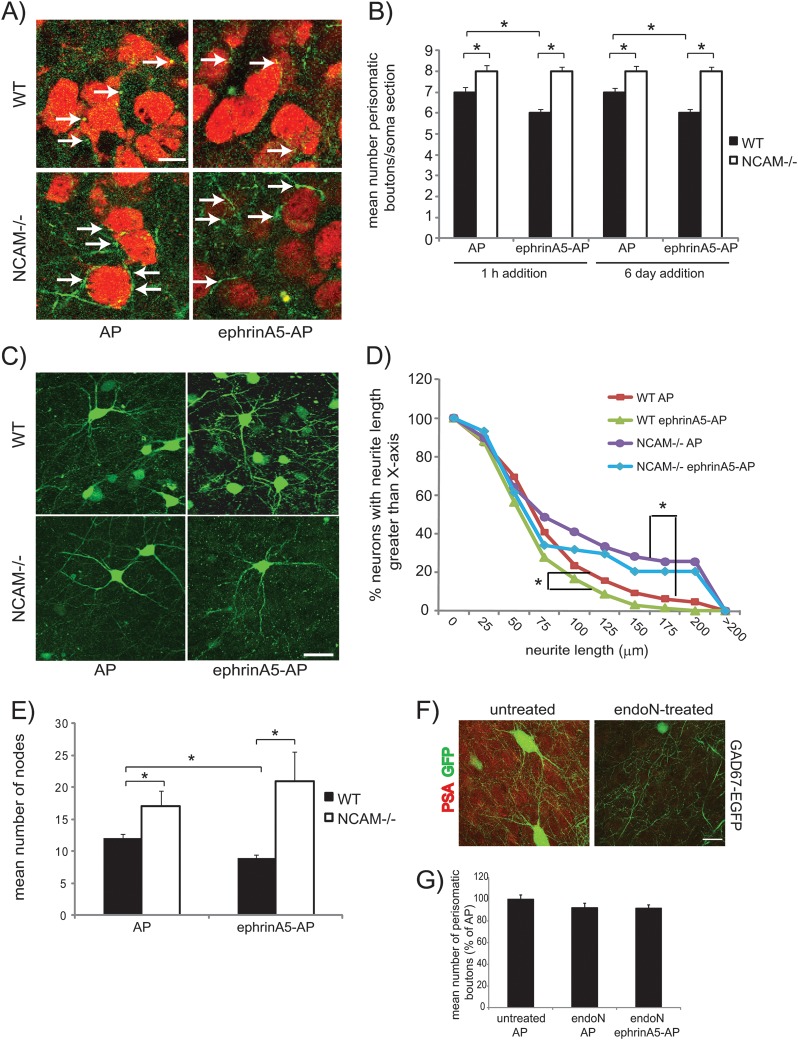
A novel function for the neural cell adhesion molecule (NCAM) was identified in ephrinA/EphA-mediated repulsion as an important regulatory mechanism for development of GABAergic inhibitory synaptic connections in mouse prefrontal cortex. Deletion of NCAM, EphA3, or ephrinA2/3/5 in null mutant mice increased the numbers and size of perisomatic synapses between GABAergic basket interneurons and pyramidal cells in the developing cingulate cortex (layers II/III). A functional consequence of NCAM loss was increased amplitudes and faster kinetics of miniature inhibitory postsynaptic currents in NCAM null cingulate cortex. NCAM and EphA3 formed a molecular complex and colocalized with the inhibitory presynaptic marker vesicular GABA transporter (VGAT) in perisomatic puncta and neuropil in the cingulate cortex. EphrinA5 treatment promoted axon remodeling of enhanced green fluorescent protein-labeled basket interneurons in cortical slice cultures and induced growth cone collapse in wild-type but not NCAM null mutant neurons. NCAM modified with polysialic acid (PSA) was required to promote ephrinA5-induced axon remodeling of basket interneurons in cortical slices, likely by providing a permissive environment for ephrinA5/EphA3 signaling. These results reveal a new mechanism in which NCAM and ephrinAs/EphA3 coordinate to constrain GABAergic interneuronal arborization and perisomatic innervation, potentially contributing to excitatory/inhibitory balance in prefrontal cortical circuitry.


Figures

Figure 1.
Figure 1.
Loss of NCAM increases the number of perisomatic synapses of GABAergic interneurons in the cingulate cortex. (A) Immunofluorescence staining of GAD65 in GABAergic interneurons of the cingulate cortex (layer II/III) showed increased labeling of perisomatic synaptic puncta (arrows) during postnatal maturation of WT and NCAM null littermates (P10–P60, n = 3–5 mice/genotype per stage), with greater labeling in NCAM null mutants. Inset box shows a nonimmune IgG control staining. Single confocal images were taken using the same settings for each genotype. Scale bar: 10 μm. (B) The mean number of GAD65-labeled perisomatic puncta per soma section was significantly increased in the NCAM null mutant cingulate cortex compared with WT (P10–P60; t-test at each age, *P < 0.005). (C) The mean area of GAD65-labeled perisomatic synaptic puncta, expressed as percent of WT, was significantly increased in NCAM null mutant cingulate cortex (P10–P60; t-test, *P < 0.005).
Figure 2.
Figure 2.
Increased amplitude and faster mIPSC time course in cingulate cortex of NCAM null mutant mice. (A) Representative current traces from pyramidal neurons in layers II/III of cingulate cortical slices from WT and NCAM null mutant mice. The calibration bar indicates pA and ms. Data low-pass filtered at 1 kHz. (B) Left: the frequency of mIPSCs was not significantly different in NCAM null and WT mice. Middle: the amplitude of mIPSCs in NCAM null mice was increased compared with WT (one-tailed t-test, P < 0.05). Right: the 10–90% rise time of mIPSCs in NCAM mice was faster compared with WT (P < 0.05). (C) The mIPSC amplitude was significantly correlated with the rise time in individual pyramidal cells for both NCAM null and WT mice (two-tailed t-test, P < 0.05), consistent with different average electrotonic distances of inhibitory synapses in individual cells. (D) The mIPSC decay-time constant was significantly correlated with the rise time in NCAM null but not WT pyramidal cells (two-tailed t-test, P < 0.05).
Figure 3.
Figure 3.
Loss of EphrinA or EphA3 increases the number and size of perisomatic synapses of GABAergic interneurons in the cingulate cortex. (A) Immunofluorescence staining for GAD65 in the cingulate cortex (layer II/III) of WT, ephrinA5-, ephrinA2/3/5-, and EphA3-null mice (P21, n = 3–5 mice per genotype) showed increased labeling of perisomatic synaptic puncta (arrows) in all mutant genotypes. Scale bar: 10 μm. (B) The mean number of GAD65-labeled perisomatic puncta per soma section was significantly increased in the cingulate cortex of ephrinA2/A3/A5-, ephrinA3-, ephrinA5-, and EphA3-null mice compared with WT and in triple mutants compared with either single mutant (t-test, *P < 0.005). (C) The mean area of GAD65-labeled perisomatic synaptic puncta, expressed as percent of WT, was significantly increased in cingulate cortex of all mutant genotypes compared with WT and in triple mutants compared with either single mutant (t-test, *P < 0.005).
Figure 4.
Figure 4.
NCAM mediates EphrinA5-induced growth cone collapse of GABAergic and non-GABAergic interneurons. (A) Dissociated cortical neurons from WT or NCAM null mice (P0) were allowed to extend neurites for 48 h prior to the addition of ephrinA5-Fc or IgG control (3 μg/mL, 30 min) and stained for GABA- and rhodamine-conjugated phalloidin to visualize growth cone collapse in GABAergic cells. Representative image of ephrinA5-Fc–treated WT cultures illustrates GABA-labeled interneurons. Collapsed (arrowhead) and noncollapsed growth cones (arrow) are indicated. Scale bars: 10 μm. (B) Quantification of the percent of GABA-expressing neurons with collapsed growth cones in response to IgG or ephrinA5-Fc treatment in WT and NCAM null cultures (n ≥ 300 growth cones per condition from 3 to 5 separate animals; t-test, *P < 0.05). (C) Quantification of the percent of GABA-negative (excitatory) neurons with collapsed growth cones in response to IgG or ephrinA5-Fc treatment in WT and NCAM null cultures (n ≥ 300 growth cones per condition from 3 to 5 separate animals; t-test, *P < 0.05).
Figure 5.
Figure 5.
PSA-NCAM mediates EphrinA5-induced remodeling of perisomatic innervation and arborization of basket interneurons in culture. (A) Slice cultures (400 μm) of cingulate cortex from GAD67-EGFP mice (P5) were cultured for 14 DIV at which time ephrinA5-AP or AP proteins (5 μg/mL) were added for 1 h. Alternatively, slices were cultured for 8 DIV at which time ephrinA5-AP or AP control (5 μg/mL) were added every other day until 14 DIV (6 day addition). Cultures were immunofluorescently labeled for NeuN (red) and EGFP (green) to visualize synaptic puncta. Representative images from single confocal planes of WT and NCAM null slices treated with AP or ephrinA5-AP for 1 h are shown. Arrows indicate perisomatic synaptic puncta onto NeuN-labeled neurons. Scale bar: 10 μm. (B) Mean number of perisomatic synapses per soma section was plotted per condition (n = 60–600 neurons per condition; t-test, *P < 0.05). Three to 5 slices per mouse per genotype were used in each case (n = 3–5 mice). (C) Basket cells from layer II/III of WT and NCAM null cingulate cortex were fully imaged through z-stacks and reconstructed with Neurolucida software. Representative images of reconstructed GAD67-EGFP basket interneurons from WT and NCAM null mice treated with AP or ephrinA5-AP for 6 days are shown (n = 3–5 slices per mouse per genotype, 3–5 mice per genotype, 60–180 neurons per condition analyzed). Scale bar: 10 μm. (D) Cumulative total neurite length per neuron was plotted as a percentage of neurons with length greater than the length indicated on the x-axis. Significant differences were observed between WT slices treated with AP versus ephrinA5-AP and between each type of WT slice and NCAM null slices (ANOVA, P < 0.01). No differences were observed between NCAM null slices treated with AP or ephrinA5-AP. (E) Mean number of nodes (branch points) was plotted for per condition (t-test, *P < 0.05). (F) Representative images of single confocal planes from endo-N–treated and endo-N–untreated slices. PSA is present in a diffuse pattern that partly colocalized with EGFP in untreated cultures (left). Endo-N efficiently removed PSA signal from slice cultures (right). Scale bar = 10 μm. (G) Mean number of perisomatic synapses per soma section was plotted per condition (n = 60–600 neurons per condition) for slices treated for 1 h with ephrinA5-AP or AP control. Three to 5 slices per mouse per condition were used in each case (n = 3–5 mice). No significant differences were observed (t-test, P > 0.05).
Figure 6.
Figure 6.
NCAM and EphA3 colocalize at presynaptic perisomatic puncta. Cingulate cortex of WT mice (P20–P23) was immunofluorescently stained and imaged by confocal microscopy. Arrows indicate perisomatic puncta (p) or neuropil (n) and are shown in higher magnification in outset boxes. A representative nonimmune IgG control (nIg) is shown in panel (A,D). Scale bar = 10 μm. Double immunofluorescence labeling for GFP and EphA3 in WT GAD67-EGFP mice (A). Staining of EphA3 null mutant cortex with EphA3 antibody or WT cortex with normal Ig (nIg; inset boxes) showed no significant labeling. Double immunofluorescence labeling for EphA3 and NCAM (B), EphA3 and PSA (C), VGAT and NCAM (D), VGAT and PSA (E), VGAT and EphA3 (F), gephyrin and NCAM (G), gephyrin and PSA (H), and gephyrin and EphA3 (I).
Figure 7.
Figure 7.
EphrinA5 localizes to pyramidal neurons. (A) EphrinA5 mRNA was detected ISH in the PFC and at somewhat elevated levels in primary somatosensory (S1) and visual (V1) areas at P15 using a digoxigenin antisense probe in sagittal sections. PFC labeling was enriched in layers II/III (B) as shown in comparison with the control sense probe (C). Increased levels of ephrinA5 mRNA were observed in S1 (D, high magnification—G) and V1 (E, high magnification—H) as compared with PFC. (F) Higher magnification in differential contrast images showed ephrinA5 mRNA labeling in soma of cells with pyramidal neuron morphology in layer III (green dashed lines), as well as in smaller soma, compared with sense probe labeling (I). Control sense probe labeling showed no detectable signal in S1 or V1 as well (not shown). Abbreviations: PFC—prefrontal cortex (cingulate cortex), S1—primary somatosensory cortex, and V1—primary visual cortex. Scale bars: 50 μm.
Figure 8.
Figure 8.
NCAM and EphA3 form a molecular complex that binds EphrinA5. (A) Forebrain lysates (1 mg) from WT mice (P15 and P21) were immunoprecipitated with nonimmune IgG (nIg) or antibodies to EphA3, EphA4, EphA7, Neuroligin 2 (NL-2), or Neurexin 1 (NRXN-1), as indicated. Proteins from immunoprecipitations or lysates were separated by SDS-PAGE and immunoblotted (IB) with the indicated antibodies. Note that in the first set of panels, the lysate for the NCAM immunoblot is from a shorter exposure time (1 min) than the other lanes (15 min), as individual bands from the lysates of the 15 min exposure were obscured by oversaturation of the signal. All other panels show lysates and immunoprecipitations from the same exposure times. (B) Freshly prepared forebrain lysates from P8 mice were treated with endo-N (40 U) for 1 h prior to immunoprecipitation with antibodies to EphA3 or nonimmune IgG (nIg). Untreated lysates from littermate mice were used as controls. Proteins from lysates or immunoprecipitations were immunoblotted for NCAM extracellular domain, PSA, or EphA3 antibodies. Note that the NCAM and PSA immunoblots are from shorter exposure times (5 s) than the IP lanes (1 or 10 min, respectively), as individual bands in the lysate were obscured by the longer exposures due to oversaturation of the signal. (C) HEK293T cells were cotransfected with NCAM140 and EphA3 cDNAs or with EphA3 alone. Lysates (500 μg) were immunoprecipitated with antibodies to EphA3, and IPs and lysates subjected to immunoblotting with antibodies to the NCAM intracellular domain (mAb OB11) or EphA3. In the NCAM immunoblot, the lysate is from a 10-s exposure and the immunoprecipitations from a 5-min exposure, as the longer exposure of the lysate obscured the individual bands. All lanes in the EphA3 immunoblot are from the same exposure time. (D) HEK293T cells were transfected with NCAM140, NCAM180, or EphA3 cDNAs alone. Cell lysates (500 μg) were incubated with ephrinA5-Fc (right) or NCAM-Fc (left) fusion proteins (2 μg) consisting of the entire extracellular domain and protein A/G agarose beads to detect protein/protein interactions via a pull-down assay. Proteins were immunoblotted with antibodies to the NCAM extracellular domain (pAb H300), EphA3 or ephrinA5. In all panels, all lanes are from the same gel and boxes outline lanes, which were cropped to remove duplicates.

Similar articles

Cited by

References

    1. Aisa B, Gil-Bea FJ, Solas M, Garcia-Alloza M, Chen CP, Lai MK, Francis PT, Ramirez MJ. Altered NCAM expression associated with the cholinergic system in Alzheimer's disease. J Alzheimers Dis. 2010;20:659–668. - PubMed
    1. Angata K, Long JM, Bukalo O, Lee W, Dityatev A, Wynshaw-Boris A, Schachner M, Fukuda M, Marth JD. Sialyltransferase ST8Sia-II assembles a subset of polysialic acid that directs hippocampal axonal targeting and promotes fear behavior. J Biol Chem. 2004;279:32603–32613. - PubMed
    1. Anney R, Klei L, Pinto D, Regan R, Conroy J, Magalhaes TR, Correia C, Abrahams BS, Sykes N, Pagnamenta AT, et al. A genomewide scan for common alleles affecting risk for autism. Hum Mol Genet. 2010;19:4072–4082. - PMC - PubMed
    1. Arai M, Yamada K, Toyota T, Obata N, Haga S, Yoshida Y, Nakamura K, Minabe Y, Ujike H, Sora I, et al. Association between polymorphisms in the promoter region of the sialyltransferase 8B (SIAT8B) gene and schizophrenia. Biol Psychiatry. 2006;59:652–659. - PubMed
    1. Arnall S, Cheam LY, Smart C, Rengel A, Fitzgerald M, Thivierge JP, Rodger J. Abnormal strategies during visual discrimination reversal learning in ephrin-A2 (-/-) mice. Behav Brain Res. 2010;209:109–113. - PubMed

Publication types