

Diffusion tensor imaging-based characterization of brain neurodevelopment in primates
- PMID: 22275483
- PMCID: PMC3513950
- DOI: 10.1093/cercor/bhr372
Diffusion tensor imaging-based characterization of brain neurodevelopment in primates
Abstract
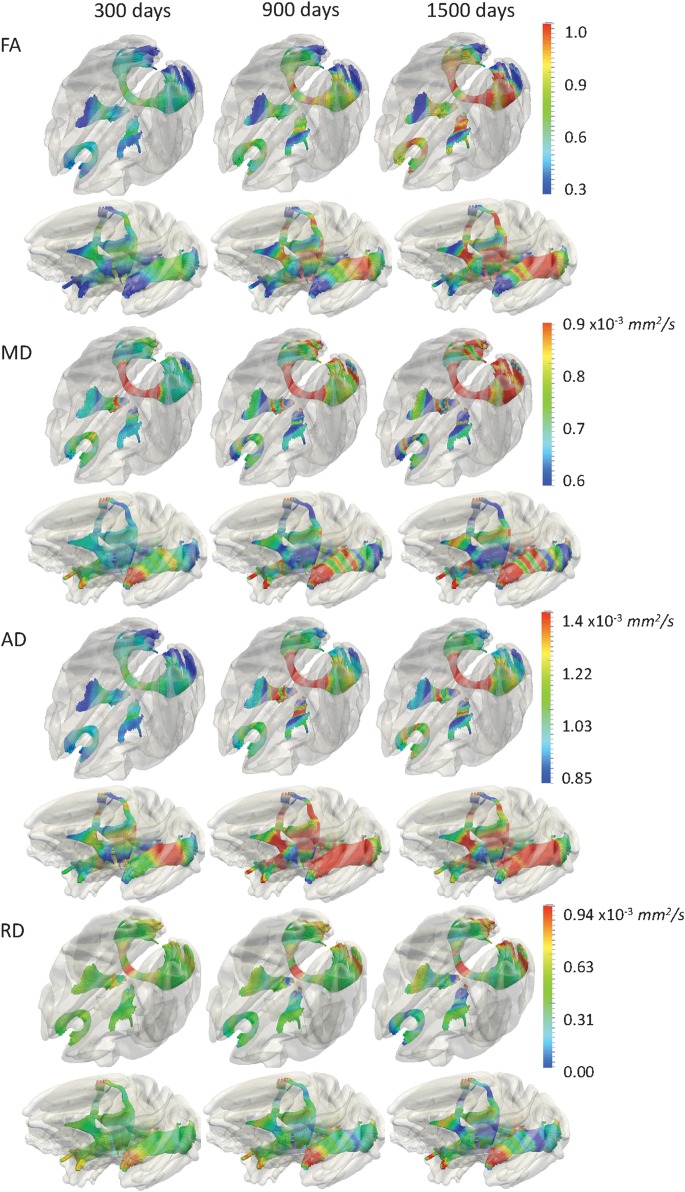
Primate neuroimaging provides a critical opportunity for understanding neurodevelopment. Yet the lack of a normative description has limited the direct comparison with changes in humans. This paper presents for the first time a cross-sectional diffusion tensor imaging (DTI) study characterizing primate brain neurodevelopment between 1 and 6 years of age on 25 healthy undisturbed rhesus monkeys (14 male, 11 female). A comprehensive analysis including region-of-interest, voxel-wise, and fiber tract-based approach demonstrated significant changes of DTI properties over time. Changes in fractional anisotropy (FA), mean diffusivity, axial diffusivity (AD), and radial diffusivity (RD) exhibited a heterogeneous pattern across different regions as well as along fiber tracts. Most of these patterns are similar to those from human studies yet a few followed unique patterns. Overall, we observed substantial increase in FA and AD and a decrease in RD for white matter (WM) along with similar yet smaller changes in gray matter (GM). We further observed an overall posterior-to-anterior trend in DTI property changes over time and strong correlations between WM and GM development. These DTI trends provide crucial insights into underlying age-related biological maturation, including myelination, axonal density changes, fiber tract reorganization, and synaptic pruning processes.
Figures


References
-
- Alexander D, Pierpaoli C, Basser P, Gee J. Spatial transformations of diffusion tensor magnetic resonance images. IEEE Trans Med Imaging. 2001;20(11):1131–1139. - PubMed
-
- Amaral DG. The primate amygdala and the neurobiology of social behavior: implications for understanding social anxiety. Biol Psychiatry. 2002;51(1):11–17. - PubMed
-
- Ashtari M, Cervellione KL, Hasan KM, Wu J, McIlree C, Kester H, Ardekani BA, Roofeh D, Szeszko PR, Kumra S. White matter development during late adolescence in healthy males: a cross-sectional diffusion tensor imaging study. Neuroimage. 2007;35(2):501–510. - PubMed
Publication types
MeSH terms
Grants and funding
- T32 HD40127/HD/NICHD NIH HHS/United States
- HD053000/HD/NICHD NIH HHS/United States
- P01 CA142538-01/CA/NCI NIH HHS/United States
- EB005149-01/EB/NIBIB NIH HHS/United States
- RR025747-01/RR/NCRR NIH HHS/United States
- P50 MH064065/MH/NIMH NIH HHS/United States
- P50 MH078105/MH/NIMH NIH HHS/United States
- AG 033387/AG/NIA NIH HHS/United States
- UL1-RR025747-01/RR/NCRR NIH HHS/United States
- U54 EB005149-01/EB/NIBIB NIH HHS/United States
- AG033387/AG/NIA NIH HHS/United States
- P50 MH078105-01A2S1/MH/NIMH NIH HHS/United States
- P30 HD003352/HD/NICHD NIH HHS/United States
- MH070890/MH/NIMH NIH HHS/United States
- P01 DA022446/DA/NIDA NIH HHS/United States
- P30 HD03110/HD/NICHD NIH HHS/United States
- T32 MH019111-13/MH/NIMH NIH HHS/United States
- P01CA142538-01/CA/NCI NIH HHS/United States
- AI067518/AI/NIAID NIH HHS/United States
- HD039386/HD/NICHD NIH HHS/United States
- R01 MH086633/MH/NIMH NIH HHS/United States
- MH086633/MH/NIMH NIH HHS/United States
- R01 MH091645/MH/NIMH NIH HHS/United States
- P01 CA142538/CA/NCI NIH HHS/United States
- K01 MH083045-01/MH/NIMH NIH HHS/United States
LinkOut - more resources
Full Text Sources
Medical
Miscellaneous
