. 2012 May;40(10):4306-19.
doi: 10.1093/nar/gks014. Epub 2012 Jan 24.

The nucleoid-associated proteins H-NS and FIS modulate the DNA supercoiling response of the pel genes, the major virulence factors in the plant pathogen bacterium Dickeya dadantii

Affiliations

The nucleoid-associated proteins H-NS and FIS modulate the DNA supercoiling response of the pel genes, the major virulence factors in the plant pathogen bacterium Dickeya dadantii

Zghidi-Abouzid Ouafa et al. Nucleic Acids Res. 2012 May.

Abstract

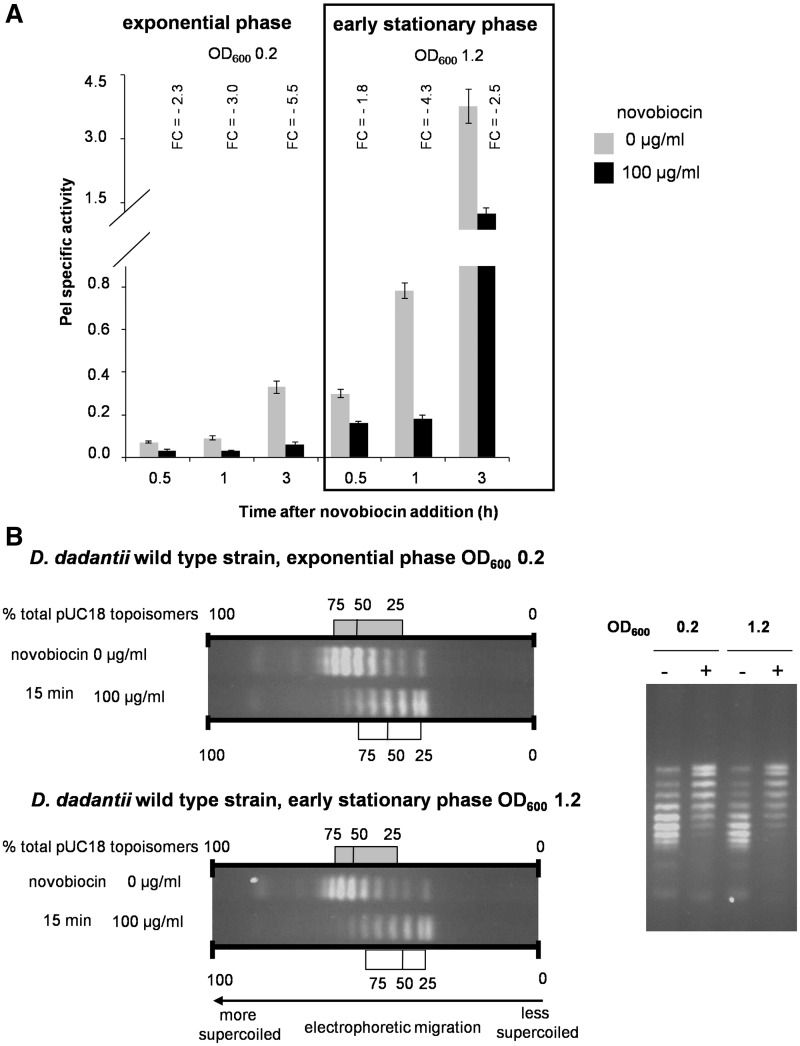
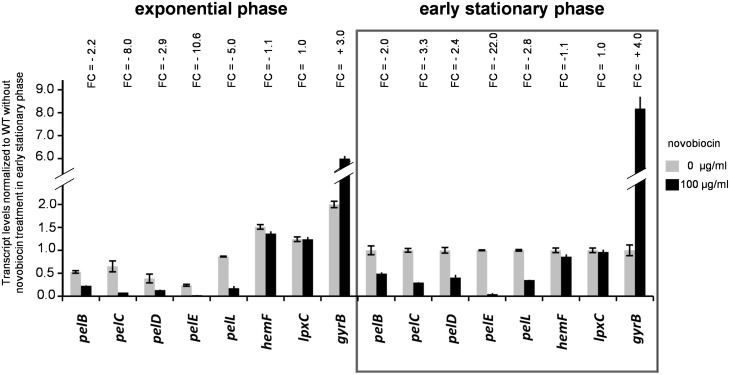
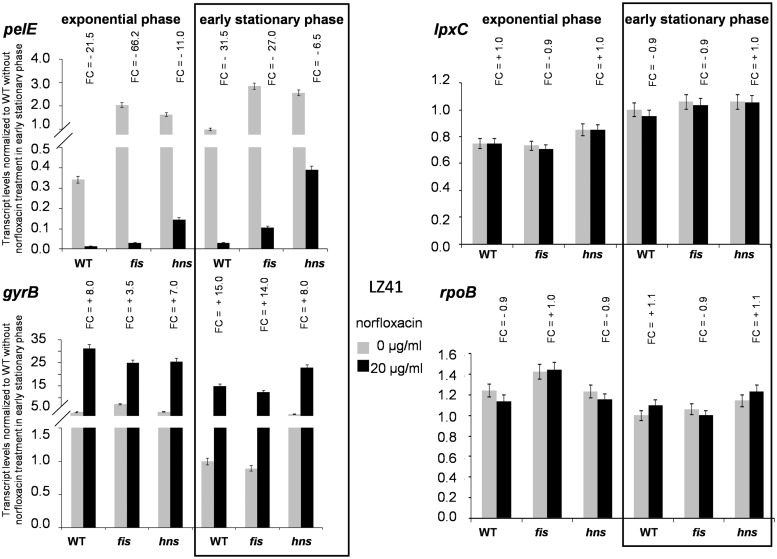
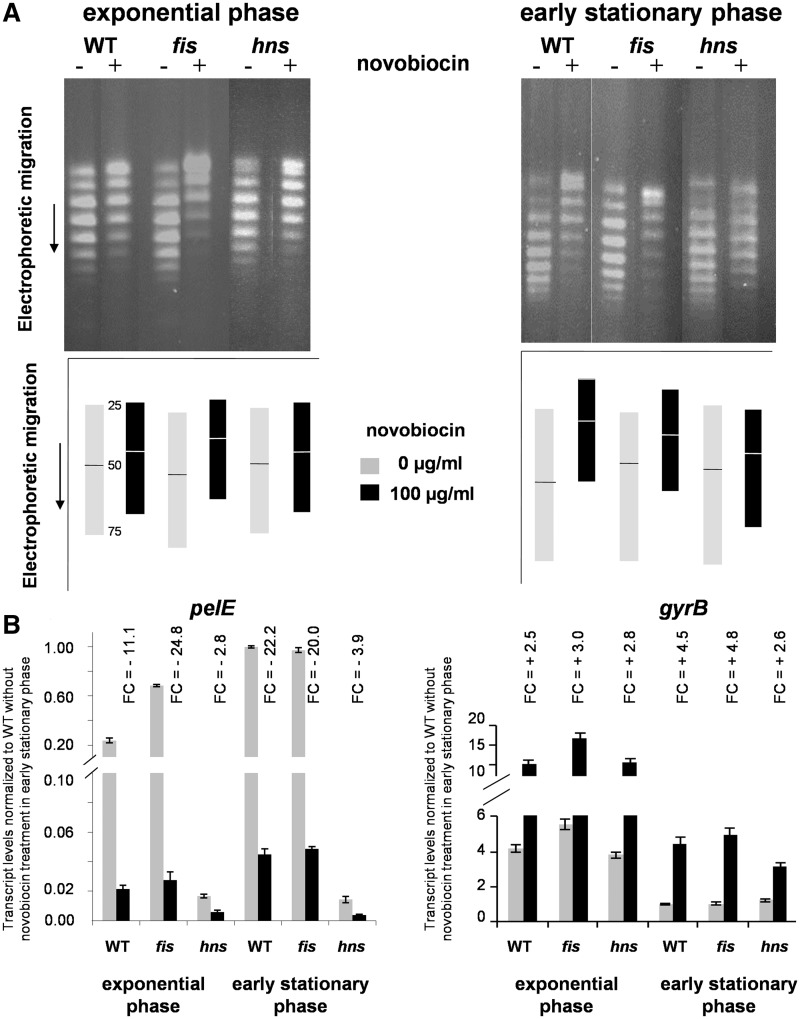
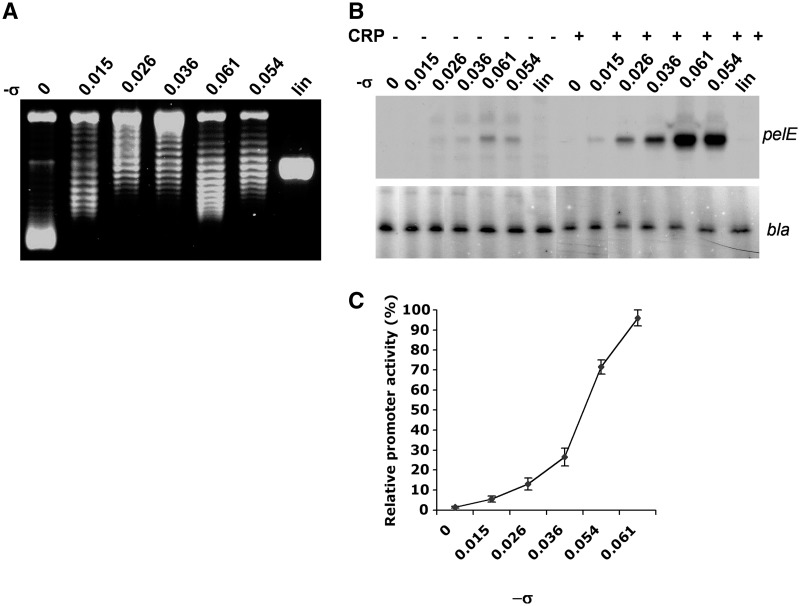
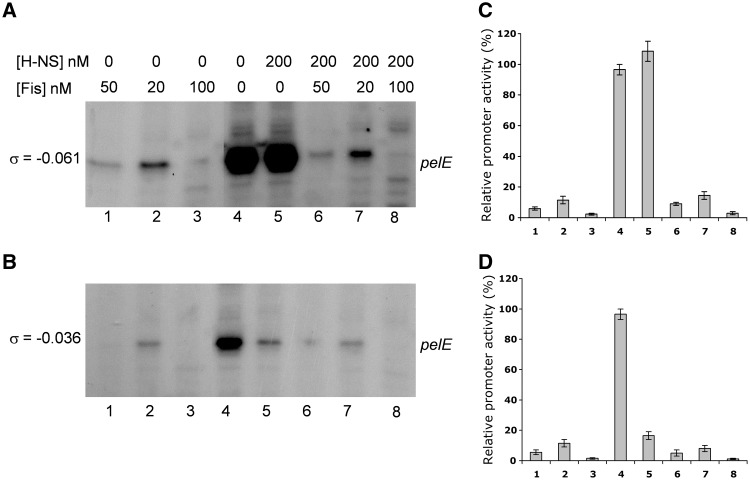
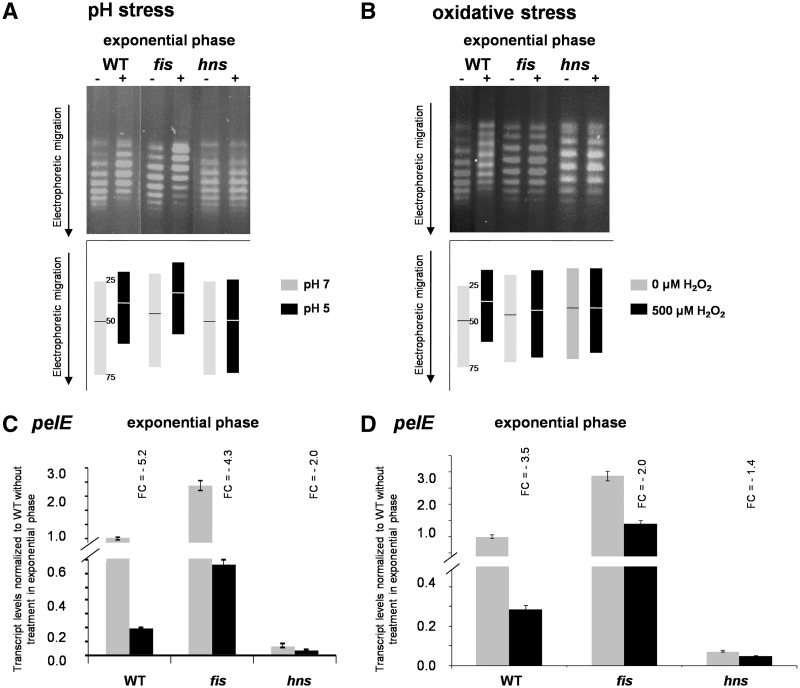
Dickeya dadantii is a pathogen infecting a wide range of plant species. Soft rot, the visible symptom, is mainly due to the production of pectate lyases (Pels) that can destroy the plant cell walls. Previously we found that the pel gene expression is modulated by H-NS and FIS, two nucleoid-associated proteins (NAPs) modulating the DNA topology. Here, we show that relaxation of the DNA in growing D. dadantii cells decreases the expression of pel genes. Deletion of fis aggravates, whereas that of hns alleviates the negative impact of DNA relaxation on pel expression. We further show that H-NS and FIS directly bind the pelE promoter and that the response of D. dadantii pel genes to stresses that induce DNA relaxation is modulated, although to different extents, by H-NS and FIS. We infer that FIS acts as a repressor buffering the negative impact of DNA relaxation on pel gene transcription, whereas H-NS fine-tunes the response of virulence genes precluding their expression under suboptimal conditions of supercoiling. This novel dependence of H-NS effect on DNA topology expands our understanding of the role of NAPs in regulating the global bacterial gene expression and bacterial pathogenicity.


Figures

Figure 1.
Figure 1.
Effect of DNA gyrase inhibition and DNA relaxation on Pel production in D. dadantii. (A) Bacteria were treated with sublethal concentration of novobiocin (100 µg/ml) and samples were removed at the indicated times and submitted to Pel activity quantification. Each value represents the mean of three experiments. Bars indicate the SD. Fold changes (FCs) are expressed as the ratio of the specific Pel activity during exposure to novobiocin, compared with that in standard growth conditions. Two different scales were used for the y-axis in order to better appreciate variations of Pel activity in the different growth phases. (B) Topoisomers of plasmid pUC18 were isolated from wild-type and separated on agarose gel containing 2.5 µg/ml chloroquine. At this concentration of chloroquine, the more negatively supercoiled topoisomers migrate faster in the gel. The experiment was performed on three separate occasions and a typical result is shown. The growth phase considered and the novobiocin treatment are indicated. Plasmid topoisomers were analysed by densitometry using image J software and the obtained results were plotted in quartiles as described by (45); here the interquartile range (25th to 75th percentile) is indicated by a filled (0 µg/ml novobiocin) or empty (100 µg/ml novobiocin) box. The picture of the entire gel is shown on the right.
Figure 2.
Figure 2.
Impact of DNA gyrase inhibition and DNA relaxation on pel gene expression in D. dadantii. Bacteria were treated with sublethal concentration of novobiocin (100 µg/ml) and samples were removed 15 min post-treatment for chromosomal gene expression analysis using qRT–PCR. The oligonucleotides used are indicated in Supplementary Table S1. The lpxC and hemF genes were used as references for normalization, and the gyrB gene was used as control for novobiocin treatment. Each value represents the mean of three experiments. Bars indicate the SD. FCs are expressed as the ratio of the specific gene-expression level during exposure to novobiocin, compared with that in standard growth conditions, normalized to the level of expression of the lpxC and hemF genes. The transcript levels for each gene obtained without novobiocin treatment in the early stationary phase was arbitrary taken as 1. Results obtained with novobiocin treatment are different from those without treatment with P < 0.05 in a one sample t-test, except for the reference genes hemF and lpxC. Two different scales were used for the y-axis in order to better appreciate variations for the different genes.
Figure 3.
Figure 3.
H-NS and FIS modulate the effect of DNA relaxation on pelE promoter activity. The genetically engineered E. coli LZ41 strain (Supplementary Table S1) and its hns and fis mutant derivatives containing plasmid pEH1 (pelE promoter-uidA fusion) were treated with norfloxacin (20 µg/ml) for 10 min before samples were removed for uidA transcript quantification using qRT–PCR as indicated in Figure 2. The strains used and the retained growth phases are indicated. The lpxC and rpoB genes were used as references for normalization and gyrB gene as control for norfloxacin treatment. Each value represents the mean of three experiments. Bars indicate the SD. FCs are expressed as the ratio of the specific gene-expression level during exposure to norfloxacin, compared with that under standard growth conditions, normalized to the expression level of the lpxC and rpoB genes. Results obtained with norfloxacin treatments are different from those without treatment with P-values < 0.05 in a one sample t-test. Two different scales were used for the y-axis in order to better appreciate expression variations in the different genetic backgrounds. The transcript levels of the pelE expression obtained in the WT strain without novobiocin treatment in the early stationary phase was arbitrary taken as 1.
Figure 4.
Figure 4.
FIS and H-NS modulate the supercoiling sentivity of the pelE gene in D. dadanti. (A) Novobiocin treatment and pUC18 plasmid topoisomers analysis were performed as described for Figure 1. (B) qRT–PCR experiments measuring the pelE and gyrB transcript levels were performed as described in Figure 2. The strains used and the analysed growth phases are indicated. Each value represents the mean of three independent experiments. Bars indicate the SD. Results obtained with novobiocin treatments are different from that without treatment with P-values < 0.05 in a one sample t-test. FCs are expressed as a ratio of the specific gene-expression level during exposure to novobiocin compared with that in the medium without novobiocin, normalized to the level of expression of the reference genes lpxC and hemF. Two different scales were used for the y-axis in order to better appreciate expression variations in the different genetic backgrounds. The transcript levels of pelE gene obtained in the WT strain without novobiocin treatment in the early stationary phase was arbitrary taken as 1.
Figure 5.
Figure 5.
Dependence of pelE transcription on superhelical density of DNA in vitro. (A) High-resolution agarose gel electrophoresis of pEH1 preparations used for in vitro transcription; the negative superhelical density of plasmid preparations (−σ-values) are indicated. The showed gel contains 2 µg/ml chloroquine; lin corresponds to linearized plasmid, 0 corresponds to circular plasmid fully relaxed by Vaccinia topoisomerase in the absence of ethidium bromide. Under the conditions of electrophoresis the fully relaxed plasmid, as well as the next most relaxed plasmid (−σ = 0.015) migrate as positively supercoiled species, whereas the plasmids with high negative superhelicity (−σ = 0.054 and −σ = 0.061) migrate as negatively supercoiled species. The plasmid populations intermediate between these (e.g. −σ = 0.026) migrate as mixtures of the negatively and positively supercoiled species. (B) Quantitative primer extension of the pelE mRNA (top) generated by in vitro transcription from pEH1 plasmids of different superhelical densities. Half of the same mRNA preparations were used to mesure bla transcription as an internal control (bottom). The concentrations of RNAP and CRP used were 50 and 20 nM, respectively. (C) Graphic representation of the dependence of pelE transcription on superhelical density in vitro. The data shown are those obtained in the presence of RNAP and CRP. All values are normalized to the amount of transcript obtained from plasmid DNA of σ = −0.061. Each value represents the mean of two independent experiments. Bars indicate the SD.
Figure 6.
Figure 6.
PelE expression regulation by H-NS is modulated by the supercoiling state of DNA. (A) Quantitative primer extension of pelE mRNA generated by in vitro transcription from plasmid of high superhelical density (σ = −0.061) showing maximal transcription (Figure 5). (B) Quantitative primer extension of pelE mRNA generated by in vitro transcription from plasmid at suboptimal superhilical density (σ = −0.036). All the experiments were performed in presence of 50 nM RNAP and 20 nM CRP; the concentrations of FIS and H-NS used are indicated above the part A. (C) Quantification of the data obtained in two independent experiments with two technical replicates at maximal superhelical density as shown in (A). (D) Quantification of the data obtained in two independent experiments with two technical replicates at suboptimal superhelical density as shown in (B). The values are normalized to the amount of transcript obtained in the absence of H-NS and FIS (lane 4). Bars indicate the SD.
Figure 7.
Figure 7.
Effect of acidic and oxidative stresses on DNA relaxation and on pelE gene expression. Acidic shock and oxidative stress were induced during exponential growth phase by malic acid and hydrogen peroxide, respectively (see ‘Materials and Methods’ section). (A) Topoisomers of plasmid pUC18 were isolated from wild-type strain and its hns and fis mutant derivatives submitted to acidic shock. (B) The same as (A) after oxidative stress. Topoisomers were separated on agarose gels containing 2.5 µg/ml chloroquine. The obtained results were plotted in quartiles as described by (45). (C) Effect of acidic shock and (D), oxidative stress on pelE gene expression; qPCR experiments and representation of the data are as described in Figure 2. FC are expressed as a ratio of the specific gene-expression level during stress conditions compared with that in standard growth conditions, normalized to the level of expression of the reference genes lpxC and hemF. Two different scales were used for the y-axis in order to better appreciate expression variations in the different genetic backgrounds. The transcript levels of pelE gene obtained in the WT strain without novobiocin treatment was arbitrary taken as 1.

Similar articles

Cited by

References

    1. Browning DF, Busby SJ. The regulation of bacterial transcription initiation. Nat. Rev. Microbiol. 2004;2:57–65. - PubMed
    1. Janga SC, Collado-Vides J. Structure and evolution of gene regulatory networks in microbial genomes. Res Microbiol. 2007;158:787–794. - PMC - PubMed
    1. Travers A, Muskhelishvili G. DNA supercoiling - a global transcriptional regulator for enterobacterial growth? Nat. Rev. Microbiol. 2005;3:157–169. - PubMed
    1. Ishihama A. Prokaryotic genome regulation: multifactor promoters, multitarget regulators and hierarchic networks. FEMS Microbiol. Rev. 2010;34:628–645. - PubMed
    1. Muskhelishvili G, Sobetzko P, Geertz M, Berger M. General organisational principles of the transcriptional regulation system: a tree or a circle? Mol. Biosyst. 2010;6:662–676. - PubMed

Publication types

MeSH terms