. 2012 Jan;8(1):e1002478.
doi: 10.1371/journal.ppat.1002478. Epub 2012 Jan 19.

Two genetic determinants acquired late in Mus evolution regulate the inclusion of exon 5, which alters mouse APOBEC3 translation efficiency

Affiliations

Two genetic determinants acquired late in Mus evolution regulate the inclusion of exon 5, which alters mouse APOBEC3 translation efficiency

Jun Li et al. PLoS Pathog. 2012 Jan.

Abstract

Mouse apolipoprotein B mRNA-editing enzyme catalytic polypeptide-like editing complex 3 (mA3), an intracellular antiviral factor, has 2 allelic variations that are linked with different susceptibilities to beta- and gammaretrovirus infections among various mouse strains. In virus-resistant C57BL/6 (B6) mice, mA3 transcripts are more abundant than those in susceptible BALB/c mice both in the spleen and bone marrow. These strains of mice also express mA3 transcripts with different splicing patterns: B6 mice preferentially express exon 5-deficient (Δ5) mA3 mRNA, while BALB/c mice produce exon 5-containing full-length mA3 mRNA as the major transcript. Although the protein product of the Δ5 mRNA exerts stronger antiretroviral activities than the full-length protein, how exon 5 affects mA3 antiviral activity, as well as the genetic mechanisms regulating exon 5 inclusion into the mA3 transcripts, remains largely uncharacterized. Here we show that mA3 exon 5 is indeed a functional element that influences protein synthesis at a post-transcriptional level. We further employed in vitro splicing assays using genomic DNA clones to identify two critical polymorphisms affecting the inclusion of exon 5 into mA3 transcripts: the number of TCCT repeats upstream of exon 5 and the single nucleotide polymorphism within exon 5 located 12 bases upstream of the exon 5/intron 5 boundary. Distribution of the above polymorphisms among different Mus species indicates that the inclusion of exon 5 into mA3 mRNA is a relatively recent event in the evolution of mice. The widespread geographic distribution of this exon 5-including genetic variant suggests that in some Mus populations the cost of maintaining an effective but mutagenic enzyme may outweigh its antiviral function.


Conflict of interest statement

The authors have declared that no competing interests exist.

Figures
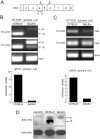
Figure 1
Figure 1. Expression of mA3 transcripts and protein in the spleens of B6 and BALB/c mice.
(A) Schematic representation of the mouse APOBEC3 exon composition. The exons are indicated by numbers and their relative sizes are depicted. The arrows indicate the locations of the PCR primers used in the following experiments. (B and C) RT-RCR and quantitative real-time PCR (qPCR) analyses showing splicing patterns and quantities of mA3 mRNA in B6 and BALB/c spleen cells. The primers utilized were c-d for assays shown in (B) and a–b for those in (C). 5+, exon 5-containing mA3; Δ5, mA3 lacking exon 5. Actin was used as an internal control. Quantitative real-time PCR data show averages of three reaction wells and SD. (D) Immunoblot detection of mA3 protein expressed in mouse spleen cells. The spleen cell extracts were tested for their total protein content by Bradford assays and the same amount of protein was loaded in each lane. Anti-mouse APOBEC3 NT antibody reactive with an N-terminal epitope was first pre-absorbed with the spleen lysate prepared from an mA3-knockout (KO) mouse, and was used as the primary antibody. Mouse actin was used as a loading control. Three independent experiments were done for all assays, and the results were consistent with the representative ones shown here.
Figure 2
Figure 2. Protein expression of the full-length and Δ5 mA3 in transiently transfected 293T cells.
(A) Exon 5-containing (5+) and Δ5 mA3 cDNA were tagged with the FLAG epitope and inserted into the expression vector. The arrows indicate the positions of the PCR primers. The primer set a-b is the same as shown in Figure 1. (B and C) 293T cells were transfected with pFLAG-CMV2-mA3d or pFLAG-CMV2-mA3dΔ5 in B or with pFLAG-CMV2-mA3b or pFLAG-CMV2-mA3bΔ5 in C, which express either the 5+ or Δ5 mA3 cDNA cloned from BALB/c or B6 mice, respectively . A luciferase-expressing plasmid, pluc, was co-transfected to standardize transfection efficiencies. At 24 hours after transfection, each one-third of the transfected cells was used for immunoblotting, RNA extraction, and luciferase assays. For immunoblotting, the full-length and Δ5 mA3 proteins were detected with the anti-FLAG antibody. Quantitative real-time PCR reactions were carried out with primer set a-b and were normalized with the levels of actin transcripts expressed in 293T cells. Data shown are averages of three reaction wells and SD. (D) RT-PCR assays were performed with (RT+) or without (RT−) reverse transcription to demonstrate specific detection of expected mRNA. Both primer sets e-f and a-b were used to detect mA3 mRNA. NC, negative control transfected with the empty vector, pFLAG-CMV2. RT– samples were included to evaluate the possible contamination of transfected DNA. Specific amplification of cDNA generated in the presence of RT was observed in the cells transfected with a plasmid expressing the 5+ or Δ5 mA3 cDNA. Similar results were obtained for the corresponding B6-derived cDNA clones.
Figure 3
Figure 3. The presence of exon 5 does not affect protein degradation but exhibits a profound impact on mA3 protein synthesis.
(A) 293T cells were transfected with pFLAG-CMV2-mA3d or pFLAG-CMV2-mA3dΔ5 along with pFLAG-CMV2-GFP, which expresses green fluorescent protein (GFP) as a loading control. The cells were treated with cycloheximide for the indicated duration to stop protein synthesis and then harvested. DMSO was used as a solvent control. The FLAG-tagged mA3 and GFP were detected with the anti-FLAG antibody in immunoblotting. Endogenous IκBα expression was used as a positive control to confirm the effect of cycloheximide. (B) In vitro transcription and translation assays. DNA templates containing the entire coding region of the BALB/c full-length or Δ5 mA3 cDNA with the T7 promoter and His-tag sequence were subjected to an in vitro transcription/translation reaction by incubating for 30 or 60 min. The levels of mA3 protein synthesis and mRNA expression were evaluated by immunoblotting using the anti-His antibody and RT-PCR using the primer set a-b, respectively. Intensities of protein bands on the immunoblot membrane and DNA bands after the RT-PCR reaction and electrophoresis were measured by densitometry and are shown below each corresponding band. *, signals below detection limits.
Figure 4
Figure 4. The impact of TCCT repeat numbers on exon 5 inclusion in mA3 mRNA splicing.
(A) Schematic representation of the genomic DNA structure of the Apobec3 gene locus. Boxes indicate exons. LTR, the endogenous retroviral LTR inserted into intron 2 in some strains of mice . (B) Insert structures of the plasmids used for the splicing assays. BALB/c exon 4–7 and BALB/c ΔTCCT plasmids harbored the same DNA fragment amplified from BALB/c genomic DNA encompassing exons 4 and 7, except that the BALB/c ΔTCCT contains only a single TCCT quadruplet. B6 exon 4–7 plasmid harbored the B6 genomic DNA fragment encompassing exons 4 and 7. C741T and T741C indicate a C to T or reciprocal nucleotide substitution, respectively, within intron 4 at 741-bp downstream from the first nucleotide of exon 4 on the backbone of the BALB/c or B6 exon 4–7 insert. An additional repeat of the TCCT quadruplet was added to the B6 exon 4–6 construct to generate B6 +TCCT. The positions of primers g, h, i, and j used for RT-PCR assays are indicated with the arrows. (C) The plasmid harboring each insert depicted in (B) was transfected into BALB/3T3 cells, total RNA was extracted, and RT-PCR reactions were performed with primer pairs g–h and i–h. A portion of the transfected cells were utilized for luciferase assays to compare transfection efficiencies among the samples. Comparable levels of luciferase activities were observed in all samples in each experiment (data not shown). The predicted splicing products are schematically indicated on the right side of the panel. Quantitative real-time PCR assays were performed with primers g and j, and data are shown here by averages of three reaction wells and SD.
Figure 5
Figure 5. The effect of exon 5 and its downstream sequences on mA3 intron 5 splicing.
(A) Distributions of sequence polymorphisms in the intron 5 of the Apobec3 gene locus between the B6 allele [NT_039621] and the Celera database sequence of mixed mouse DNA [NW_001030577.1]. Shorter horizontal lines below the thick one representing intron 5 indicate regions of sequenced BALB/c genome [DDBJ accession No. AB646261-AB646265], which show nucleotide sequences identical to corresponding Celera database sequences. Spans of the analyzed regions are 1–620, 661–1597, 1643–2058, 2759–3443, and 5558–6247 in base numbers starting from the first nucleotide of intron 5. SNP are shown with vertical lines, single-base indels with arrows, and deletions of ≥2 bases with triangles. Indels and deletions above the thick horizontal line that represents intron 5 are deletions in the B6 allele relative to the Celera sequence, while those underneath the horizontal line are deletions in the Celera sequence relative to the B6 allele sequence. (B) Plasmid constructions for the splicing assays. The exon 5–6 plasmids harbored either the B6 or BALB/c genomic fragment encompassing exons 5 and 6, including the entire intron 5 of the corresponding allele. Each of the remaining plasmids possessed a sequentially reduced length of the intron 5 as indicated. The precise size of each PCR-generated 5′ fragment included was as follows: 3177bp and 3185bp for B6 and BALB/c intron 5-Δ3′; 2106bp and 2086bp for B6 and BALB/c 200bp intron 5; 1120bp and 1110bp for B6 and BALB/c 1100bp intron 5; and 634bp and 620bp for B6 and BALB/c 600bp intron 5, respectively. The primers g–h are the same as shown in Figure 4. (C) RT-PCR detection of spliced messages expressed from the B6 and BALB/c exon 5–6 plasmids along with those from the exon 4–7 plasmids as controls. Primers g and h were used. A lack of expression of the spliced message in cells transfected with the B6 exon 5–6 plasmid was evident. (D and F) Splicing assays using intron 5 deletion plasmids. The intron 5 fragment included in each plasmid is shown in (B). RT-PCR assays were performed with primers g and h. A portion of the transfected cells were utilized for luciferase assays to compare transfection efficiencies among the samples as shown in (C). Comparable levels of luciferase activities were observed in all samples in each experiment (data not shown). Quantitative real-time PCR data show averages of three reaction wells and SD. (E) Reciprocal chimeras were produced between B6 and BALB/c exon 5–6 by exchanging the cloned genomic DNA fragment at position 1100 within intron 5. The exact location of the above position 1100 for B6 and BALB/c intron 5 is described in the legend for (B). RT-PCR detection of spliced messages was performed with primers g and h. A portion of the transfected cells were utilized for luciferase assays to compare transfection efficiencies.
Figure 6
Figure 6. Identification of critical residues for exon 5 inclusion into mA3 mRNA.
(A) Polymorphic nucleotides indicated with the shades were exchanged at the boxed sites between the B6 and BALB/c alleles. The numbers 14, 88, 153, and 163 above the shown nucleotide sequence are base numbers from the first nucleotide of exon 5. (B and C) The results of splicing assays performed with the plasmids depicted in (A). The predicted splicing product is shown on the right side of each panel. Band intensities are averages of 3 independent RT-PCR reactions with SD.
Figure 7
Figure 7. The G88C nucleotide substitution in exon 5 is most critical for exon 5 inclusion into mA3 mRNA.
(A) Polymorphic nucleotides indicated with the shades were exchanged between the B6 and BALB/c alleles at the sites indicated with the boxes. Plasmids used here carry the entire intron 5 instead of the deleted one used in the experiments shown in Figure 6. (B and C) The results of splicing assays using the plasmids depicted in panel (A). The predicted splicing product is shown on the right side of each panel. RT-PCR assays were performed with primers g and h. A portion of the transfected cells were utilized for luciferase assays to compare transfection efficiencies among the samples. Comparable levels of luciferase activities were observed in all samples in each experiment (data not shown). Quantitative real-time PCR data show averages of three reaction wells and SD.
Figure 8
Figure 8. Effect of the combination of intron 4 TCCT repeat and exon 5 G/C SNP on exon 5 inclusion into the mA3 transcripts.
B6 exon 4–7 + TCCT and BALB/c exon 4–7 ΔTCCT plasmids, as described in Figure 4, were further modified so that the exon 5 G/C SNP nucleotide at position 88 was reciprocally exchanged. The resultant plasmids were used for in vitro transcription assays as described for Figures 4– 7. RT-PCR assays were performed with primers g and h. A portion of the transfected cells were utilized for luciferase assays to compare transfection efficiencies among the samples. Quantitative real-time PCR data show averages of three reaction wells and SD.
Figure 9
Figure 9. Distribution of sequence variations in and around the Apobec3 exon 5 in Mus species and strains.
(A) The Apobec3 genomic sequences of the indicated strains and representative species are shown. The five SNP tested for their effects on exon 5 splicing are indicated with shaded bars. Also shown are the number of TCCT repeats and typing results indicating the presence or absence of exon 5 (Ex5) in spliced messages and the presence or absence of an MuLV LTR in intron 2. (B) The phylogenetic tree is a synthetic tree adapted from other sources –. Species are grouped into the 4 Mus subgenera and are listed to the right of each branch. Subspecies and stock or inbred line designations are given where multiple samples of a given species were tested. Red, exon 5+/MuLV LTR; blue, Δ5/MuLV LTR+; green, Δ5/MuLV LTR. *, mice tested for exon 5 splicing pattern. All were sequenced across exon 5 (Figure S1); PERA and MOLF sequence information was taken from Okeoma et al. . (C) Distribution of expression variants of mA3 in mice trapped in Europe. The red line represents the 20 km-wide hybrid zone separating the ranges of M. domesticus and M. musculus. Symbols representing mA3 allelic variants are placed at trapping sites.

Similar articles

Cited by

References

    1. Bogerd HP, Wiegand HL, Doehle BP, Lueders KK, Cullen BR. APOBEC3A and APOBEC3B are potent inhibitors of LTR-retrotransposon function in human cells. Nucleic Acids Res. 2006;34:89–95. - PMC - PubMed
    1. Bogerd HP, Wiegand HL, Hulme AE, Garcia-Perez JL, O'Shea KS, et al. Cellular inhibitors of long interspersed element 1 and Alu retrotransposition. Proc Natl Acad Sci USA. 2006;103:8780–8785. - PMC - PubMed
    1. Chen H, Lilley CE, Yu Q, Lee DV, Chou J, et al. APOBEC3A is a potent inhibitor of adeno-associated virus and retrotransposons. Curr Biol. 2006;16:480–485. - PubMed
    1. Esnault C, Heidmann O, Delebecque F, Dewannieux M, Ribet D, et al. APOBEC3G cytidine deaminase inhibits retrotransposition of endogenous retroviruses. Nature. 2005;433:430–433. - PubMed
    1. Esnault C, Millet J, Schwartz O, Heidmann T. Dual inhibitory effects of APOBEC family proteins on retrotransposition of mammalian endogenous retroviruses. Nucleic Acids Res. 2006;34:1522–1531. - PMC - PubMed

Publication types

MeSH terms

LinkOut - more resources