. 2012 Jan;8(1):e1002460.
doi: 10.1371/journal.pgen.1002460. Epub 2012 Jan 19.

Cohesin protects genes against γH2AX Induced by DNA double-strand breaks

Affiliations

Cohesin protects genes against γH2AX Induced by DNA double-strand breaks

Pierre Caron et al. PLoS Genet. 2012 Jan.

Abstract

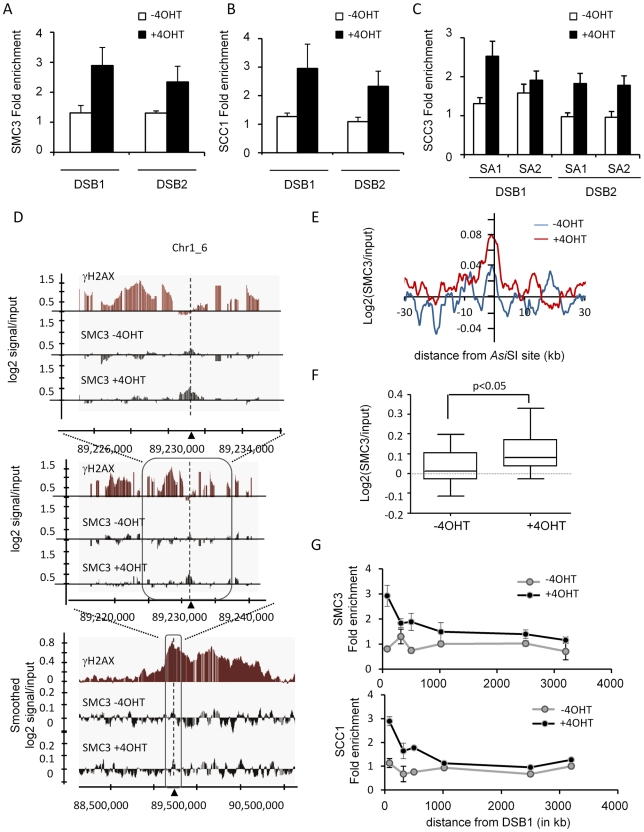
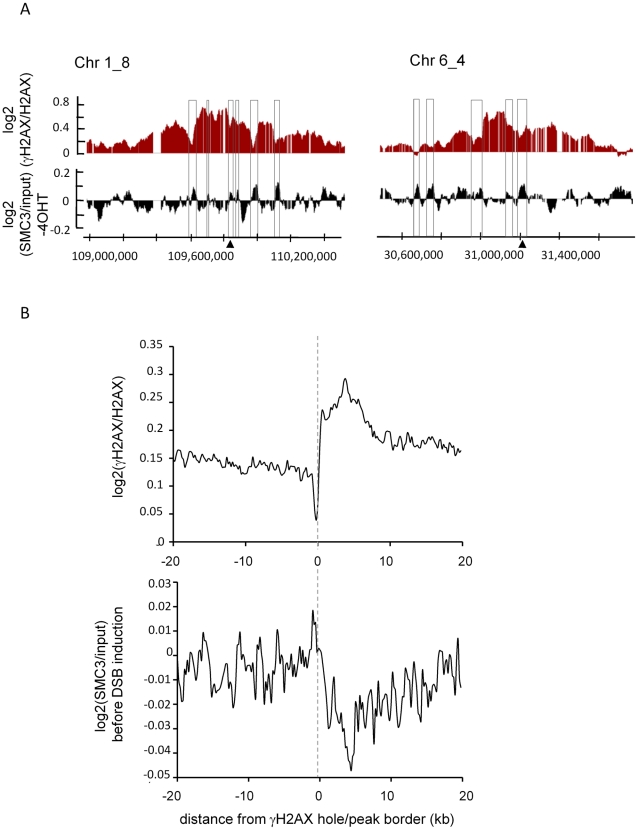
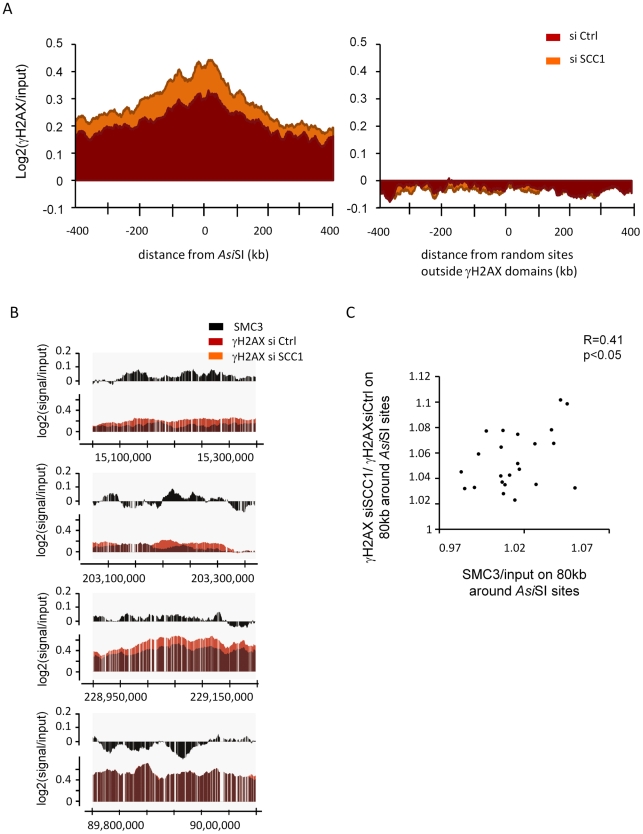
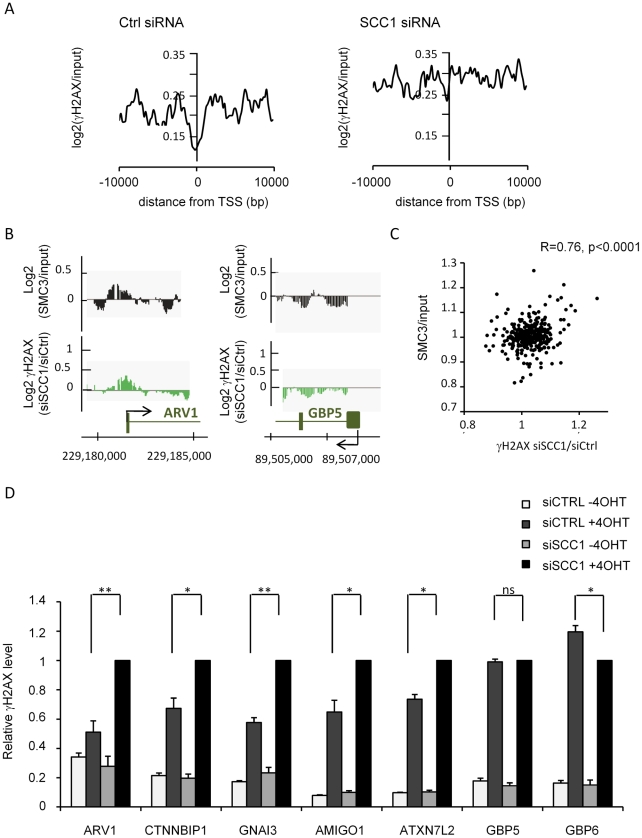
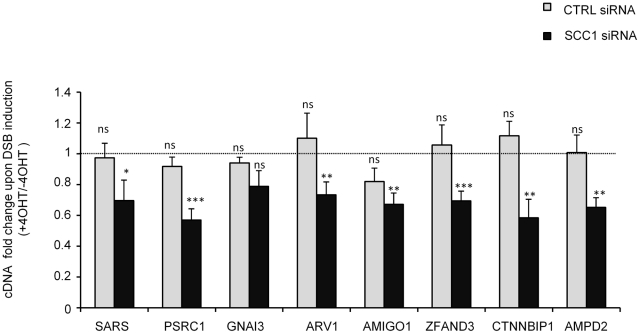
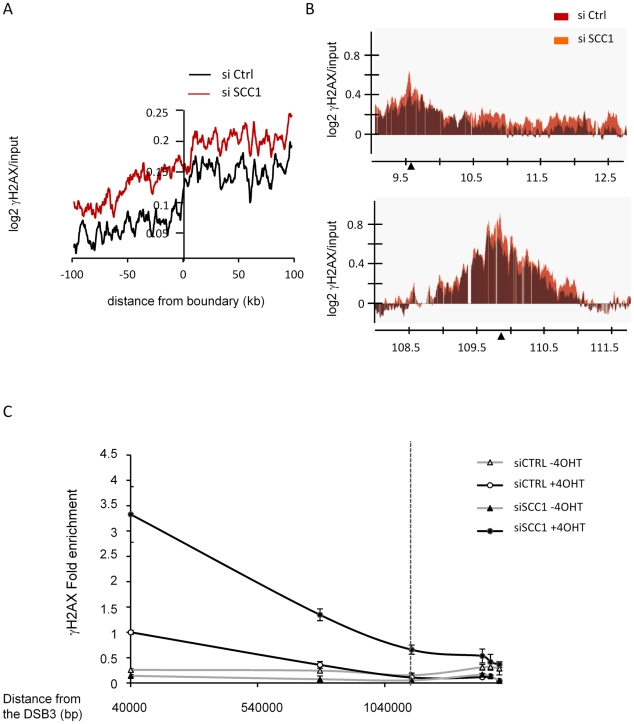
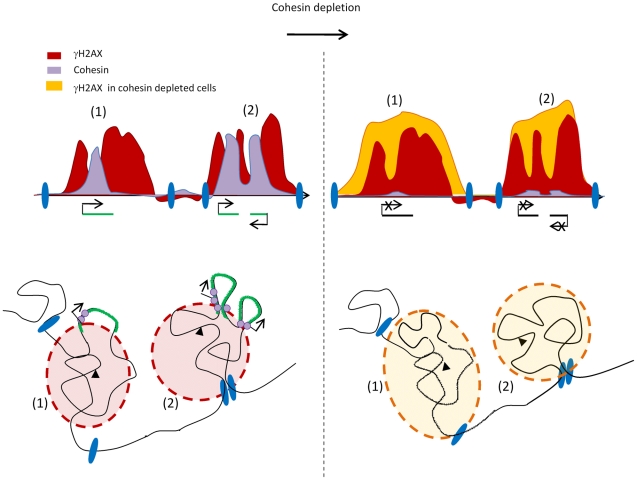
Chromatin undergoes major remodeling around DNA double-strand breaks (DSB) to promote repair and DNA damage response (DDR) activation. We recently reported a high-resolution map of γH2AX around multiple breaks on the human genome, using a new cell-based DSB inducible system. In an attempt to further characterize the chromatin landscape induced around DSBs, we now report the profile of SMC3, a subunit of the cohesin complex, previously characterized as required for repair by homologous recombination. We found that recruitment of cohesin is moderate and restricted to the immediate vicinity of DSBs in human cells. In addition, we show that cohesin controls γH2AX distribution within domains. Indeed, as we reported previously for transcription, cohesin binding antagonizes γH2AX spreading. Remarkably, depletion of cohesin leads to an increase of γH2AX at cohesin-bound genes, associated with a decrease in their expression level after DSB induction. We propose that, in agreement with their function in chromosome architecture, cohesin could also help to isolate active genes from some chromatin remodelling and modifications such as the ones that occur when a DSB is detected on the genome.


Conflict of interest statement

The authors have declared that no competing interests exist.

Figures

Figure 1
Figure 1. SMC3 is recruited locally around DSBs on the mammalian genome.
A, SMC3 ChIPs were performed on AsiSI-ER-U20S cells, before and after 4 hours of 4OHT treatment and SMC3 enrichment was scored by Quantitative RealTime PCR (Q-PCR) in the vicinity (respectively 80 bp and 200 bp) of two AsiSI-induced DSBs as indicated. The fold enrichment relative to a genomic sequence devoid of AsiSI site (2 MB away from the closest site) is presented. Mean and Standard deviation of the mean (SDOM) of 4 independent experiments are shown. B, Same as in A, except that an SCC1 antibody (Abcam) was used. C, Same as in A, except that SA1 or SA2 antibodies were used. D, SMC3 ChIPs before and after 4 hours of 4OHT treatment were hybridized on Human Tiling Array 2.0R-A covering chromosomes 1 and 6. The log2 of the SMC3/input ratio is presented around one of the AsiSI sites (indicated by an arrow). The γH2AX profile previously characterized is shown in red. Successive views are presented. For the widest view (bottom panel) the signals were smoothed using a sliding window size of 500 probes. Note that the SMC3 enrichment after 4OHT treatment is only detectable in the vicinity of the AsiSI site. E, Average SMC3 profile before (blue) and after (red) 4OHT treatment, plotted relative to AsiSI site positions. F, The average log2 (SMC3/input) over a 2000 bp window centered on DSB, for the 24 cleaved AsiSI sites of the chromosome 1 and 6 (see Table S1), was calculated before and after 4OHT treatment. The distribution is represented as a box plot. The p value (paired t-test) is indicated above. G, SMC3 and SCC1 ChIP were performed before and after 4OHT treatment and spreading was monitored by Q-PCR using primers pairs located respectively at 80 bp, 319 bp, 500 bp, 1019 bp, 2500 bp and 3200 bp away from the DSB1. The fold enrichments relative to a genomic sequence devoid of AsiSI site are plotted. A representative experiment is shown.
Figure 2
Figure 2. SMC3 counteracts γH2AX.
A, Detailed views of the γH2AX/H2AX signal after 4OHT treatment (red) and the SMC3/input signal before 4OHT treatment (black) around two AsiSI sites (indicated by arrows), expressed as log2 and smoothed using a 500 probes sliding window. B, Regions depleted in γH2AX inside the γH2AX domains were identified using the algorithm detailed in (applied on the average of two 4OHT-induced γH2AX/H2AX ChIP-chip studies). 534 “hole” borders were aligned and overlaid, right and mirror left borders are combined. Profiles are shown for γH2AX (Top) and SMC3 (Bottom) over a 40 kb window centered on the hole borders and averaged using a 200 bp window size. Note the enrichment of SMC3 in the γH2AX holes.
Figure 3
Figure 3. Cohesin depletion leads to an increase of γH2AX.
A, γH2AX ChIP-chip were performed after 4OHT treatment in control (black) or SCC1 depleted (red) cells. The log2 γH2AX/input signal from two independent experiments was averaged around the 24 digested AsiSI sites from chromosomes 1 and 6 (see Table S1) (left panel), or on averaged around 24 random sites located outside γH2AX domains (right panel). B, Detailed views of the ChIP-chip signals (from two experiments) obtained for SMC3 (black), γH2AX in control cells (red) and γH2AX in cells treated with SCC1 siRNA (orange), on three cohesin-bound regions (upper and middle panels) and one cohesin-unbound region (lower panel). C, The averaged SMC3 signal over an 80 kb window around each AsiSI site was calculated (x-axis) and plotted against the γH2AX ratio in cells transfected with siRNA_SCC1 versus siRNA_CTRL (y axis). The correlation coefficient and the p value are indicated.
Figure 4
Figure 4. γH2AX accumulates on cohesin-bound genes and promoters in SCC-deficient cells.
A, The γH2AX/input signal after 4OHT treatment (average from duplicate experiments), smoothed using a 200 bp window, is plotted relative to the TSS from all 359 genes located within γH2AX domains. The left panel shows the distribution in control cells and the right panel shows the distribution in cells transfected with SCC1 siRNA. B, Detailed views of the ChIP-chip signal from two experiments obtained on ARV1 (cohesin rich) and GBP5 (cohesin poor) promoters. Log2 SMC3/input (black) and the ratio of γH2AX in SCC1 siRNA versus Control siRNA transfected cells (expressed as Log2) (green) are presented. C, For each gene encompassed in γH2AX domains, the SMC3 signal was averaged and plotted against the ratio of γH2AX in SCC1/CTRL siRNA transfected cells. D, Levels of γH2AX at various locations were analysed by ChIP in siRNA transfected AsiSI-ER-U20S cells. For each primer pair, data are expressed relative to the γH2AX signal obtained in SCC1 transfected cells. The mean and standard deviation of the mean (SDOM) from four independent experiments are shown. p value between CTRL and SCC1 siRNA transfected cells, treated with 4OHT, are indicated above (* p<0.05, ** p<0.01).
Figure 5
Figure 5. Cohesin is required to ensure transcriptional maintenance in γH2AX domains after 4OHT treatment.
RNAs were prepared and reverse transcribed from AsiSI-ER-U20S cells transfected with control or SCC1 siRNA before and after 4 hours of 4OHT treatment (as indicated). cDNA levels for several genes encompassed in γH2AX domains were measured by Quantitative PCR. Data were normalized against P0 (ribosomal protein) cDNA. Data were expressed as cDNA fold change between 4OHT treated and untreated cells. The mean and SDOM from five independent experiments are shown. The p value above each bar indicates one sample t-test against a theoretical ratio of 1 (no change between +4OHT and −4OHT) (* p<0.1, ** p<0.05, *** p<0.01).
Figure 6
Figure 6. Involvement of cohesin at γH2AX domains boundaries.
A, Boundaries of γH2AX domains (from the average of two 4OHT-induced γH2AX/input ChIP-chips) were determined in control cells using our previously described algorithm (see Table S2). Data were aligned and overlaid with the right and mirror left borders combined. Data are shown over a 200 kb window centered on boundaries and averaged using a 10 kb window size. Profiles are shown for γH2AX in control cells (black) and in SCC1 siRNA transfected cells (red). B, Detailed views of two γH2AX domains. The γH2AX profile from control cells (red) is presented with the γH2AX profile from SCC1 depleted cells (orange). Upper panel, the γH2AX signal, is able to spread further in SCC1 depleted cells. Lower panel, the γH2AX signal upon SCC1 depletion does not spread beyond the domain defined in control cells. Note that although both domains show different behaviors for γH2AX at the boundary, they both show a similar increase in γH2AX levels upon SCC1 depletion. C, γH2AX ChIP performed in 4OHT-treated control and SCC1 depleted cells were analyzed by Q-PCR, using primer pair located at various positions from the right boundary of the domain presented Figure 6B top panel. Data are expressed relative to the value obtained with the first primers pair (41 kb) in CTRL cells treated with 4OHT (set to 1). A representative experiment is shown. The position of the boundary identified in control cells by analyzing ChIP-chip with our algorithm is represented by a dotted line.
Figure 7
Figure 7. Model of 3D γH2AX spreading.
Upon DSB induction (black triangle) γH2AX spreads within a nuclear space (γH2AX foci in red). Some regions within γH2AX foci could be withdrawn to be, for example transcribed (green loop), therefore leading to “holes” within the γH2AX domain, when depicted linearly (upper panel). The cohesin normally present along the chromosomes in undamaged cells, (purple circle) may play a role after DSB induction, in keeping such genes outside of γH2AX foci due to their long range interaction properties. They could thereby protect genes from the surrounding chromatin changes and ensure their correct transcription. Upon cohesin depletion (right panel) these loops would reintegrate γH2AX foci leading both to the increase of γH2AX on genes and a decrease in transcription. In addition, γH2AX foci could be demarcated by large chromosomal domains, anchored via unknown components (blue ellipses). On some domains (1), the increase in γH2AX upon cohesin depletion would extend the limits of γH2AX until it either fades away or reaches a chromosomal domain transition (blue ellipse). On other domains (2), cohesin depletion would not lead to an extension of γH2AX spreading, due to the pre-existence of a chromosomal domain transition at the boundary. These elements which define chromosomal domains transitions are unlikely to be cohesins since there is no correlation between γH2AX boundary position and cohesin binding.

Similar articles

Cited by

References

    1. Rossetto D, Truman AW, Kron SJ, Cote J. Epigenetic modifications in double-strand break DNA damage signaling and repair. Clin Cancer Res. 2010;16:4543–4552. - PMC - PubMed
    1. van Attikum H, Gasser SM. The histone code at DNA breaks: a guide to repair? Nat Rev Mol Cell Biol. 2005;6:757–765. - PubMed
    1. Celeste A, Fernandez-Capetillo O, Kruhlak MJ, Pilch DR, Staudt DW, et al. Histone H2AX phosphorylation is dispensable for the initial recognition of DNA breaks. Nat Cell Biol. 2003;5:675–679. - PubMed
    1. Ward IM, Minn K, Jorda KG, Chen J. Accumulation of checkpoint protein 53BP1 at DNA breaks involves its binding to phosphorylated histone H2AX. J Biol Chem. 2003;278:19579–19582. - PubMed
    1. Celeste A, Petersen S, Romanienko PJ, Fernandez-Capetillo O, Chen HT, et al. Genomic instability in mice lacking histone H2AX. Science. 2002;296:922–927. - PMC - PubMed

Publication types

MeSH terms