. 2012 Jan;8(1):e1002465.
doi: 10.1371/journal.pgen.1002465. Epub 2012 Jan 19.

Progressive polycomb assembly on H3K27me3 compartments generates polycomb bodies with developmentally regulated motion

Affiliations

Progressive polycomb assembly on H3K27me3 compartments generates polycomb bodies with developmentally regulated motion

Thierry Cheutin et al. PLoS Genet. 2012 Jan.

Abstract

Polycomb group (PcG) proteins are conserved chromatin factors that maintain silencing of key developmental genes outside of their expression domains. Recent genome-wide analyses showed a Polycomb (PC) distribution with binding to discrete PcG response elements (PREs). Within the cell nucleus, PcG proteins localize in structures called PC bodies that contain PcG-silenced genes, and it has been recently shown that PREs form local and long-range spatial networks. Here, we studied the nuclear distribution of two PcG proteins, PC and Polyhomeotic (PH). Thanks to a combination of immunostaining, immuno-FISH, and live imaging of GFP fusion proteins, we could analyze the formation and the mobility of PC bodies during fly embryogenesis as well as compare their behavior to that of the condensed fraction of euchromatin. Immuno-FISH experiments show that PC bodies mainly correspond to 3D structural counterparts of the linear genomic domains identified in genome-wide studies. During early embryogenesis, PC and PH progressively accumulate within PC bodies, which form nuclear structures localized on distinct euchromatin domains containing histone H3 tri-methylated on K27. Time-lapse analysis indicates that two types of motion influence the displacement of PC bodies and chromatin domains containing H2Av-GFP. First, chromatin domains and PC bodies coordinately undergo long-range motions that may correspond to the movement of whole chromosome territories. Second, each PC body and chromatin domain has its own fast and highly constrained motion. In this motion regime, PC bodies move within volumes slightly larger than those of condensed chromatin domains. Moreover, both types of domains move within volumes much smaller than chromosome territories, strongly restricting their possibility of interaction with other nuclear structures. The fast motion of PC bodies and chromatin domains observed during early embryogenesis strongly decreases in late developmental stages, indicating a possible contribution of chromatin dynamics in the maintenance of stable gene silencing.


Conflict of interest statement

The authors have declared that no competing interests exist.

Figures
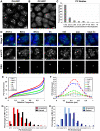
Figure 1
Figure 1. PC enrichments within PC bodies depend on the length of genomic domains coated by PC.
A–C: Non-normal distribution of PC enrichment within PC bodies. 3D images of embryos expressing PH-GFP (A) or PC-GFP (B) show intense and faint PC bodies. The scale bar is 2 µm. Histogram showing the distribution of PC enrichment within PC bodies (C). D–H: The amount of PC within a PC body depends on the genomic length of regions bound by PC. 2D images of Immuno-FISH experiments performed with probes located in large (∼400 kb: ANT-C and ∼340 kb: BX-C), medium (∼200 kb: NK-C) or small (∼50 kb: hh, hth and svp) genomic regions coated by PC, as well as probes directed against beat-Vc which is not coated by PC (D). The scale bar is 2 µm. Cumulative histograms of PC enrichment measured within the FISH volumes (N>500 for each FISH probe) (E). 1-µm profiles of PC enrichment along lines crossing their corresponding FISH volumes (N>57 for each FISH probe) (F). Histograms showing that homologous chromosome pairing increases the enrichment of PC within PC bodies containing ANT-C (p<0.001, KS test with N>190) (G) or BX-C loci (p<0.001, KS test with N>175) (H).
Figure 2
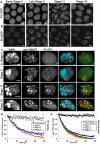
Figure 2. Progressive enrichment of PC-GFP and PH-GFP within PC bodies during embryogenesis.
A: 3D visualization of living embryos expressing PC-GFP at different developmental stages. B: 3D visualization of living embryos expressing PH-GFP at different developmental stages. During early development, both PC-GFP and PH-GFP form faint PC bodies and their intensity progressively increases during mid-embryogenesis. C: 3D visualization of fixed nuclei taken from embryos expressing PC-GFP and immuno-labeled with anti-Histone H3K27me3. At any developmental stage, H3K27me3 is distributed in numerous small dots, which never co-localize with DAPI-dense regions. Before stage 5, PC bodies are difficult to observe because of nucleoplasmic PC-GFP but, starting from stage 5, accumulation of PC-GFP is observed in nuclear structures containing H3K27me3. Bars measure 2 µm. D–E: FLIP experiments monitoring the changes of PC-GFP kinetics during embryogenesis. FLIP experiments were performed on embryos expressing PC-GFP by collecting 2D images every 1.3 s for 80 s. A fixed spot of about 500 nm was bleached for 0.3 s every two images during entire time-lapse experiments. The loss of fluorescence inside the most intense PC body of each nucleus (D) and the loss of fluorescence within the nucleoplasm (E) globally slow down during embryogenesis (N>19 for each developmental stage).
Figure 3
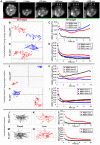
Figure 3. Both PC bodies and chromatin domains display complex motion within the cell nucleus.
A–F: Quantification of the motion of PC bodies and chromatin domains. Mean square displacements (MSD) describing the motion of PC bodies (PC-GFP: A–B) and chromatin domains (H2Av-GFP: C). Mean square changes (MSC) illustrating the motion of PC bodies (PC-GFP: D–E) and chromatin domains (H2Av-GFP: F). Time-points were collected every 250 ms for short time-lapse experiments (A, C, D, F) and every 3 s for longer ones (B and E). G–I: Absence of correlation between MSD and MSC. Scatter-plots for the MSD of each PC body or chromatin domain and their corresponding MSC, computed for motions of 5 s (G and I) or 60 s (H). J–L: Narrow angles are over-represented in tracks of PC bodies and chromatin domains. Histograms presenting the occurrence of angles calculated between three consecutive time-points in tracks of PC bodies (J and K) or chromatin domains (L).
Figure 4
Figure 4. Evidence for coordinated motion of chromatin domains and PC bodies.
A: A cell nucleus expressing H2Av-GFP was half-bleached and subsequent time-lapse movies show obvious coordinated motions of several chromatin domains (arrows). The scale bar is 2 µm. B–E: Coordinated long-range motion of chromatin domains and PC bodies. Tracks of two chromatin domains (B) or PC bodies (D) inside one nucleus and their corresponding MSD/t and MSC/t curves over time (C and E). In both cases, the two tracked structures coordinately move because their MSD/t curves are much higher than their corresponding MSC/t curves (C and E). F–I: Independent long-range motion of chromatin domains and PC bodies: Tracks of two chromatin domains (F) or two PC bodies (H) inside one nucleus and their corresponding MSD/t and MSC/t curves over time (G and I). The corresponding MSC/t curves indicate a faster motion than MSD/t curves, indicating that the two tracked structures independently move. J–O: Constrained motion of chromatin domains and PC bodies. Single tracks of chromatin domains (J and K) or PC bodies (M and N) with their corresponding MSD/t curves over time (L and O). Although a similar decrease is observed in fixed and living cells (L and O), both PC bodies and chromatin domains move since their corresponding MSD/t curves are higher in living embryos than after fixation. The MSD/t curves observed in fixed cells depend on the accuracy of image segmentation required to calculate the tracks of chromatin domains and PC bodies (J and M). In living embryos, some tracks of chromatin domains (K) and PC bodies (N) seem to loop around a preferential position, which explains why their corresponding MSD/t curves rapidly reach an asymptote approaching zero (L and O). Each grey line is spaced by 100 nm (B, D, F, H, J, K, M and N).
Figure 5
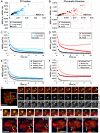
Figure 5. Characterization of the motion of PC bodies and chromatin domains.
A–B: Discrimination between tracks of PC bodies (A) or chromatin domains (B), showing only constrained motion and the ones displaying both constrained and long-range motions. A correlation between the MSD/t after 3 s and the difference of MSD/t between 3 s and 10 s (full squares and diamonds) indicates only one component in the motion, whereas long-range motion disturbs this correlation in other cases (empty diamonds and squares). C–D: Quantification of constrained and long-range motion. MSD/t curves over time, monitoring the constrained motion of PC bodies (C) or chromatin domains (D), rapidly decrease and reach asymptotes towards zero, indicating that both structures rapidly reach the limits of their volume of confinement when no long-range motion is observed. In contrast, MSD/t curves over time of PC bodies (C) or chromatin domains (D) displaying both constrained and long-range motions rapidly decrease and then stay approximately horizontal. E–F: The intensity of PC bodies and chromatin domains influences their motion. MSD/t curves over time of intense PC bodies (E) or intense chromatin domains (F) stay below the ones of weak PC bodies or chromatin domains (p<0.001, t-test on log values reached after 1 s). G–J: Chromatin domains and PC bodies form distinct structures undergoing occasional coordinated long-range motion. 2D images from an embryo at developmental stage 15 expressing both H2B-RFP and PC-GFP (G) present an example of independent motion of PC bodies (arrow) compared to surrounding chromatin (arrowhead). 4D images illustrate both distinct local motion of PC bodies from the surrounding chromatin visualized with H2B-RFP (H) and simultaneous coordinated motion of both (arrows in I and J).
Figure 6
Figure 6. The fast local motion of PC bodies is less constrained than that of chromatin domains.
A–C: Mean square change (MSC) monitoring the motion of PC bodies (PH-GFP: A and PC-GFP: B) and chromatin domains (H2Av-GFP: C) during embryogenesis. The kinetics of PC bodies monitored by PC-GFP or PH-GFP are similar throughout embryogenesis. Although PC bodies and chromatin domains similarly slow down during development, chromatin domains consistently move less than PC bodies (p<0.001, KS test calculated with MSC values reached after 1 s). D–F: Histograms presenting the frequency of angles calculated between three consecutive time-points in tracks of PC bodies (PH-GFP: D and PC-GFP: E) or chromatin domains (F). Narrow angles are over-represented in tracks of PC bodies and condensed chromatin domains throughout embryogenesis. G–I: Scatter plots comparing the average radius of the volume in which PC bodies (PH-GFP: blue points and PC-GFP: red points) or chromatin domains (black points) move, with the distance between the two objects tracked.
Figure 7
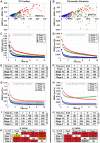
Figure 7. Both constrained and long-range motions of PC bodies and chromatin domains decrease during embryonic development.
A–B: Scatter-plots of the MSD/t after 3 s and the difference of MSD/t between 3 s and 10 s for PC bodies (A) and chromatin domains (B). Full diamonds and squares correspond to tracks showing only constrained motion, whereas empty diamonds and squares correspond to tracks displaying both constrained and long-range motions. C–F: Constrained motion of PC bodies and chromatin domains decreases during embryonic development. MSD/t curves over time monitoring the constrained motion of PC bodies (C) or chromatin domains (D) at developmental stages 5, 11 and 15. Tables presenting the corresponding radius of confinement of PC bodies (E) and chromatin domains (F). G–J: Long-range motion of PC bodies and chromatin domains also decreases during embryonic development. MSD/t curves over time monitoring long-range and constrained motions of PC bodies (G) or chromatin domains (H) at developmental stages 5, 11 and 15. Tables presenting the radius of the volumes in which PC bodies (I) and chromatin domains (J) move. K–L: Tables of p-values calculated using t-tests on the log values of MSD/t reached after 5 s for PC bodies (K) and chromatin domains (L) (C = constrained tracks; LR = tracks with long-range motion) (red p<0.001; orange p<0.01; yellow p<0.05 and grey p>0.05).

Similar articles

Cited by

References

    1. Jenuwein T, Allis CD. Translating the histone code. Science. 2001;293:1074–1080. - PubMed
    1. Shao Z, Raible F, Mollaaghababa R, Guyon JR, Wu CT, et al. Stabilization of chromatin structure by PRC1, a Polycomb complex. Cell. 1999;98:37–46. - PubMed
    1. Simon JA, Kingston RE. Mechanisms of Polycomb gene silencing: knowns and unknowns. Nat Rev Mol Cell Biol 2009 - PubMed
    1. Schwartz YB, Pirrotta V. Polycomb silencing mechanisms and the management of genomic programmes. Nat Rev Genet. 2007;8:9–22. - PubMed
    1. Schuettengruber B, Chourrout D, Vervoort M, Leblanc B, Cavalli G. Genome regulation by polycomb and trithorax proteins. Cell. 2007;128:735–745. - PubMed

Publication types

MeSH terms