. 2012 Jan;8(1):e1002478.
doi: 10.1371/journal.pgen.1002478. Epub 2012 Jan 19.

Insulin signaling regulates fatty acid catabolism at the level of CoA activation

Affiliations

Insulin signaling regulates fatty acid catabolism at the level of CoA activation

Xiaojun Xu et al. PLoS Genet. 2012 Jan.

Abstract

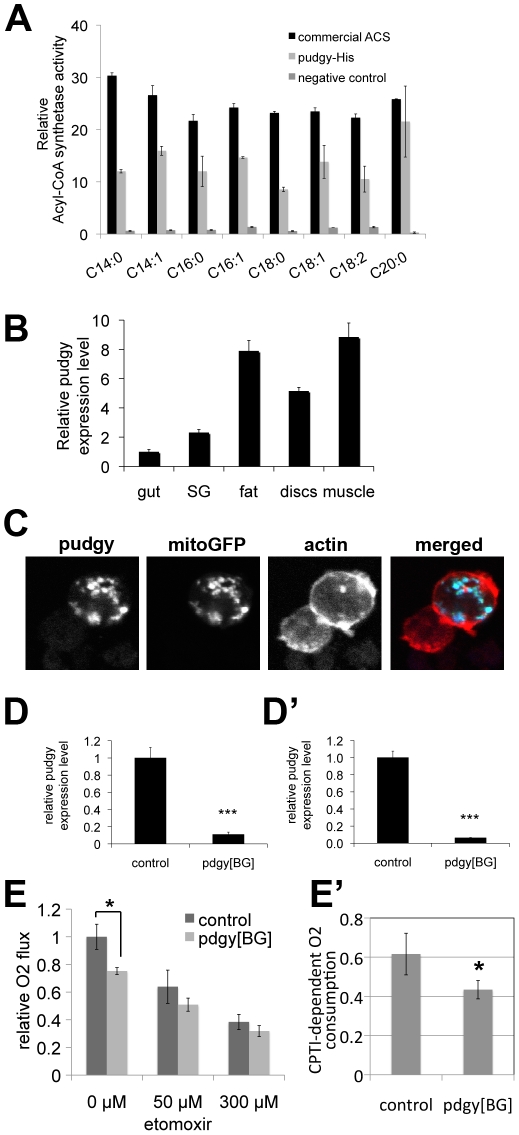
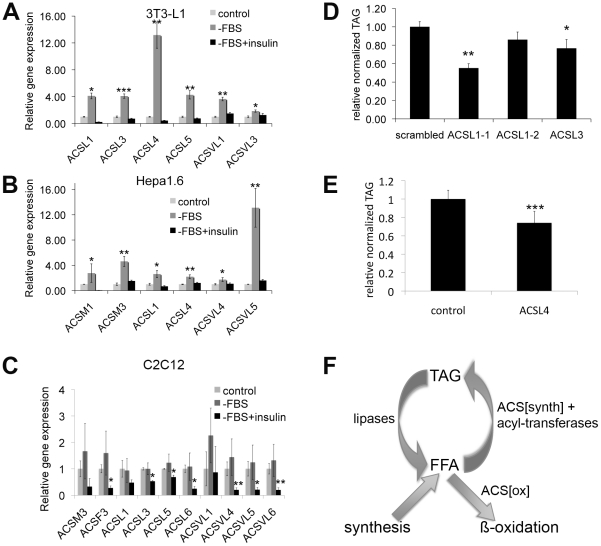
The insulin/IGF signaling pathway is a highly conserved regulator of metabolism in flies and mammals, regulating multiple physiological functions including lipid metabolism. Although insulin signaling is known to regulate the activity of a number of enzymes in metabolic pathways, a comprehensive understanding of how the insulin signaling pathway regulates metabolic pathways is still lacking. Accepted knowledge suggests the key regulated step in triglyceride (TAG) catabolism is the release of fatty acids from TAG via the action of lipases. We show here that an additional, important regulated step is the activation of fatty acids for beta-oxidation via Acyl Co-A synthetases (ACS). We identify pudgy as an ACS that is transcriptionally regulated by direct FOXO action in Drosophila. Increasing or reducing pudgy expression in vivo causes a decrease or increase in organismal TAG levels respectively, indicating that pudgy expression levels are important for proper lipid homeostasis. We show that multiple ACSs are also transcriptionally regulated by insulin signaling in mammalian cells. In sum, we identify fatty acid activation onto CoA as an important, regulated step in triglyceride catabolism, and we identify a mechanistic link through which insulin regulates lipid homeostasis.


Conflict of interest statement

The authors have declared that no competing interests exist.

Figures

Figure 1
Figure 1. Pudgy is a direct FOXO target, upregulated upon fasting.
(A) Simplified schematic of triacylglycerol catabolism. Triacylglycerides (TAG) are cleaved by lipases, releasing free fatty acids (free FA). These are linked to CoA by acyl-CoA synthetases (ACSs). Acyl-CoA moities are then either oxidized via beta-oxidation or used for biosynthetic reactions. (B,C) pudgy expression is upregulated in a FOXO-dependent manner upon nutrient withdrawal in 3rd instar larvae. Control (B) or FOXO21/25 null mutants (C) were either fed or deprived of food for 18 hours, and expression of pudgy in fat body or muscle analyzed by quantitative RT-PCR relative to rp49. (D) Schematic of pudgy (pdgy, CG9009) genomic locus. Site of the P-element P{GT1}BG02662 insertion in the 5′UTR of pdgy is indicated. Asterisks: FOXO binding sites. P1 and P2: amplicons tested in the FOXO chromatin IP in panel F. (E) Luciferase assay testing FOXO-responsiveness of genomic enhancers. Genomic fragments containing the FOXO enhancer of the bona-fide FOXO target 4E-BP (4EBP>Luc), or containing three of the FOXO binding sites in pudgy intron 1 (pudgy>Luc) were introduced into a luciferase vector containing a basal promoter and firefly luciferase (+>Luc). Relative luciferase induction in the presence versus absence of FOXO expression is indicated, normalized to a renilla luciferase control. (F) FOXO binds the pudgy promoter region. Quantification by Q-PCR of chromatin immunoprecipitated (ChIP) material from FOXO mutant animals using anti-FOXO antibody (“FOXO mutant”, a negative control) or from wildtype animals using either pre-immune serum (“mock ChIP”, a negative control) or anti-FOXO antibody (“FOXO ChIP”). Promoter regions assayed were those of 4E-BP (a direct FOXO target), mir-278 and sty (two negative controls) and two regions of the first intron of pudgy, P1 and P2, as indicated in Panel D. (G) Insulin signaling represses pudgy expression in fat body and muscle. Pudgy expression in tissues explanted from feeding 3rd instar larvae treated in Schneider's medium with or without 10 µg/ml insulin for 30 min, quantified by Q-RT-PCR relative to rp49. (H) pudgy expression increases in third instar larvae upon wandering. pudgy mRNA levels measured by quantitative RT-PCR relative to rp49 for feeding (“fL3”) and wandering (“wL3”) 3rd instar larvae. For all panels, Error bars: Std. Dev., * ttest<0.05, ** ttest<0.01, ***ttest<0.001.
Figure 2
Figure 2. Pudgy is an ACS localized to mitochondria influencing lipid oxidation.
(A) Recombinant pudgy protein exhibits ACS activity in vitro. Equal amounts of recombinant, commercial ACS from the Free Fatty Acids Quantification Kit (Biovision) (“commercial ACS”), purified recombinant His-tagged pudgy protein (“pudgy-His”), or an equivalent amount of eluate from a parallel purification with bacteria not expressing pudgy-His (“negative control”), were mixed with free fatty acids and CoA in vitro. The rate of synthesis of acyl-CoA is indicated. All ACS activities for commercial ACS and pudgy-His were significantly above negative control background (ttest<0.05). (B) pudgy expression measured by Q-RT-PCR relative to rp49 in various tissues of wildtype 3rd instar larvae, as indicated. SG: salivary gland. (C) Pudgy localizes to mitochondria. Immunofluorescence micrograph of S2 cells transfected to express pudgy-HA (blue) and mito-GFP to mark mitochondria (green) shows very good co-localization of the two proteins. Actin staining (red) delineates the cell outline. (Pearson's correlation = 0.84±0.04 on 8 images [50]). (D–D′) pudgy expression, by Q-RT-PCR relative to rp49, in control w1118 or pdgy[BG] mutant feeding 3rd instar larvae (96 h AEL) (D) or adult males (D′). (E) Lipid oxidation in pdgy[BG] mutants is impaired. Oxygen consumption rate, measured using a Clark electrode, is significantly reduced in pdgy[BG] mutant larvae (light bars) compared to controls (dark bars) (*ttest = 0.03). This difference is abrogated in the presence of the CPT1 inhibitor etomoxir, indicating it is due to a difference in lipid oxidation. (E′) pdgy[BG] mutants have significantly reduced CPTI-dependent oxygen consumption. CPTI-dependent O2 consumption was calculated by subtracting the rate of oxygen consumption in the presence of 300 µM etomoxir (ie CPTI independent) from the total rate of oxygen consumption in the absence of drug.
Figure 3
Figure 3. Pudgy expression levels regulate organismal lipid homeostasis.
(A–A′) pudgy overexpression causes leanness. Relative total body triglycerides normalized to total body protein of wL3 larvae (A) or adults (A′) ubiquitously overexpressing pudgy from an inducible UAS-transgene with the tubulin-GAL4 or actin-GAL4 drivers (tubG4>>pudgy or actinG4>pudgy), or in the two control parental genotypes, which by themselves do not overexpress pudgy (GAL4 only and UAS-pudgy only). (B–B′) pudgy mutants are fat. Relative total body triglycerides normalized to total body protein of control or pdgy[BG] mutant wL3 larvae (B) or adult males (B′), as well as pdgy[BG] mutants simultaneously carrying UAS-pudgy. The pdgy[BG] insertion is concurrently a loss-of-function insertion as well as a GAL4 gene trap. (C) Lipidomic profiling of control versus pdgy[BG] mutant adult males. Many but not all triacylglyceride (TAG) species are significantly elevated in pudgy mutants. The 20 most abundant TAGs are indicated. Values for each TAG are normalized to 1 in control animals. Numbers in parentheses indicate total carbon number of the combined fatty acid chains and total level of desaturation, or values for each individual fatty acid when known. For all panels, Error bars: Std. Dev., *ttest<0.05, **ttest≤0.01, ***ttest<0.001.
Figure 4
Figure 4. pudgy mutants have an altered lipid catabolic profile upon fasting.
(A) pdgy[BG] mutants have significantly improved survival under starvation conditions. Control w1118 (dashed line) and pdgy[BG] (solid line) 3-day-old males starved on 0.8% agarose/PBS (n = 90, log rank P = 3×10⁻⁸). (B–B′) pdgy[BG] mutants display delayed lipid catabolism upon starvation. Relative total body triglycerides normalized to total body protein of control and pdgy[BG] L2 larvae (84 h AEL) (B) or adults (B′) fasted for 0, 2, 4, 6 or 8 hours. (C) Nile red staining of early L3 larval fat bodies reveals larger lipid droplets in pdgy[BG] mutants compared to controls, both under fed conditions and when starved for 24 h on 0.8% agarose/PBS. Scare bars: 50 µm. (D) Pudgy mutants have aberrant levels of free fatty acids. Free fatty acid levels obtained by lipidomic profiling of control and pdgy[BG] mutant adults under fed and 16-hour fasting (“starved”) conditions. Measurements annotated with different letters are significantly different from each other (ttest<0.01). # indicates lipid species for which the drop in concentration observed in control animals upon fasting is significantly impaired in the mutant. (E–E′) pdgy[BG] mutants have an altered profile of lipid catabolism upon fasting. Levels of TAG(39∶1) (E) and TAG(53∶3) (E′) were quantified by UPLC-MS lipidomic profiling of control or pdgy[BG] mutant adult males after 0 and 16 hours of fasting. For all panels, assays done in triplicate, Error bars: Std. Dev., * ttest<0.05, ** ttest≤0.01, ***ttest<0.001.
Figure 5
Figure 5. Pudgy mutants have reduced insulin signaling and carbohydrate metabolism defects.
(A–A′) Pudgy mutant feeding L3 larvae (96 h AEL) (A) and adults (A′) have reduced expression of ILPs, and elevated expression of 4E-BP, a gene suppressed by insulin signaling. Assayed by quantitative RT-PCR relative to rp49. (B–B′) Pudgy mutants are mildly reduced in size. Weight of control (w1118) and pdgy[BG] wL3 larvae (B) or adult males (B′). (C–C′) Pudgy mutants have reduced glycogen stores. Total body glycogen normalized to total body weight for wL3 larvae (C) or adults (C′). (D–D′) Pudgy mutants have elevated levels of circulating sugars. Relative trehalose levels of control and pdgy[BG] mutant wandering 3rd instar larvae (D) or adults (D′). (E) pdgy[BG] mutants have extended lifespan. Lifespan of control (dotted line) or pdgy[BG] mutant (black line) males, reared under controlled growth conditions and maintained on normal laboratory food (30 flies per tube, in octuplicate, log rank P = 10−15). (F) Pudgy overexpression causes hypoglycemia. Relative trehalose levels normalized to total body weight of wandering 3rd instar larvae ubiquitously overexpressing pudgy from an inducible UAS-transgene with the actin-GAL4 driver (actinG4>>pudgy) or in the two control parental genotypes, which by themselves do not overexpress pudgy (actinG4/+ and UAS-pudgy/+). For all panels unless noted, assays done in triplicate, Error bars: Std. Dev., *ttest<0.05, **ttest≤0.01, ***ttest≤0.001.
Figure 6
Figure 6. Expression of many ACSs is regulated by insulin in mammals, and their expression level affects lipid homeostasis.
(A–C) Expression of selected Acyl-CoA synthetases in 3T3-L1 adipocytes (A), Hepa1.6 hepatoma cell line (B) or C2–C12 myotubes (C) treated with complete DMEM (control), DMEM lacking serum (−FBS), or DMEM lacking serum but supplemented with 5 µg/mL insulin (−FBS+insulin). Cells were serum starved for 1 hour (3T3-L1) or for 4 hours (Hepa1.6 and C2C12), and then treated with or without insulin (5 µg/ml for 3T3-L1 and Hepa1.6, 100 nM for C2C12) for 1 (3T3-L1 and Hepa1.6) or 2 hours (C2C12). Expression was measured by quantitative RT-PCR normalized to beta-actin. Since C2–C12 myotubes are differentiated by culturing in medium with low serum, the control and –FBS conditions are similar. Stars indicate statistical significance relative to control (3T3-L1, Hepa1.6) or to –FBS (C2C12). (D) Knockdown of ACSL1 or ACSL3 expression causes reduced triglyceride levels in differentiated 3T3-L1s. Relative total triglycerides normalized to total protein for 3T3-L1 cells treated with control siRNA (scambled) or siRNA targeting ACSL1 (ACSL1-1 and ACSL1-2) or ACSL3 shortly prior to differentiation. (E) Knockdown of ACSL4 expression causes reduced triglyceride levels in differentiated 3T3-L1 cells. Relative total triglycerides normalized to total adiponectin levels, a marker for differentiation, for control 3T3-L1s or 3T3-L1s treated with shRNA targeting ACSL4. (F) Simplified schematic representation of fatty acid metabolism. Fatty acids cycle between a free form (FFA) and a stored form as triacylglycerol (TAG). FFA are released from TAG by the action of lipases, wherease FFA are re-esterified via the sequential action of a subset of acyl-CoA synthetases and acyl-transferases. Neither lipases nor acyl-transferases can create or destroy fatty acids. Fatty acids are destroyed via the action of acyl-CoA synthetases which activate them for beta-oxidation. For all panels, assays done in triplicate. Error bars: std. dev. * ttest<0.05, **ttest<0.01, ***ttest<0.001.

Similar articles

Cited by

References

    1. Grewal SS. Insulin/TOR signaling in growth and homeostasis: a view from the fly world. Int J Biochem Cell Biol. 2009;41:1006–1010. - PubMed
    1. Nakae J, Kido Y, Accili D. Distinct and overlapping functions of insulin and IGF-I receptors. Endocr Rev. 2001;22:818–835. - PubMed
    1. Taguchi A, White MF. Insulin-like signaling, nutrient homeostasis, and life span. Annu Rev Physiol. 2008;70:191–212. - PubMed
    1. Newsholme EA, Dimitriadis G. Integration of biochemical and physiologic effects of insulin on glucose metabolism. Exp Clin Endocrinol Diabetes. 2001;109(Suppl 2):S122–134. - PubMed
    1. Pascale A, Pais R, Ratziu V. An overview of nonalcoholic steatohepatitis: past, present and future directions. J Gastrointestin Liver Dis. 2010;19:415–423. - PubMed

Publication types

MeSH terms