. 2011 Dec 5:5:138.
doi: 10.3389/fnhum.2011.00138. eCollection 2011.

Early (n170/m170) face-sensitivity despite right lateral occipital brain damage in acquired prosopagnosia

Affiliations

Early (n170/m170) face-sensitivity despite right lateral occipital brain damage in acquired prosopagnosia

Esther Alonso Prieto et al. Front Hum Neurosci. .

Abstract

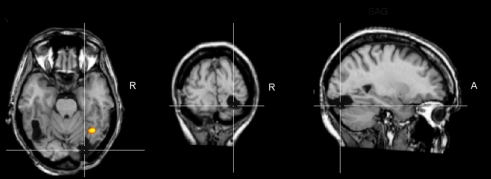
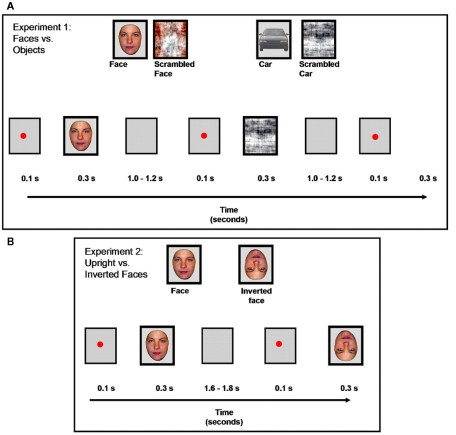
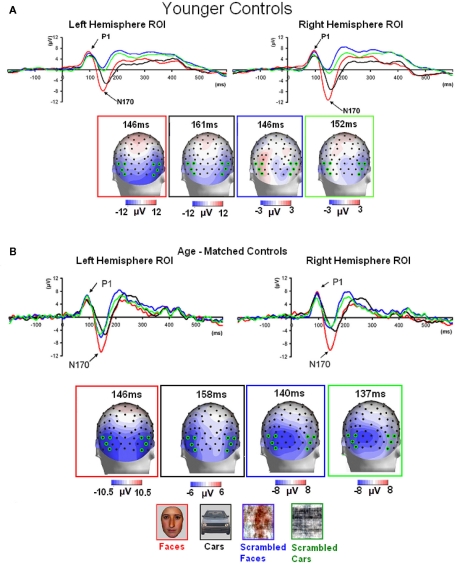
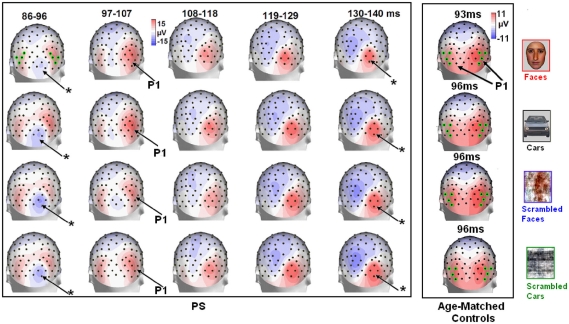
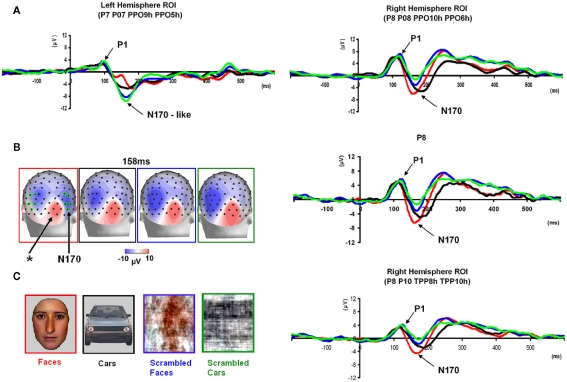
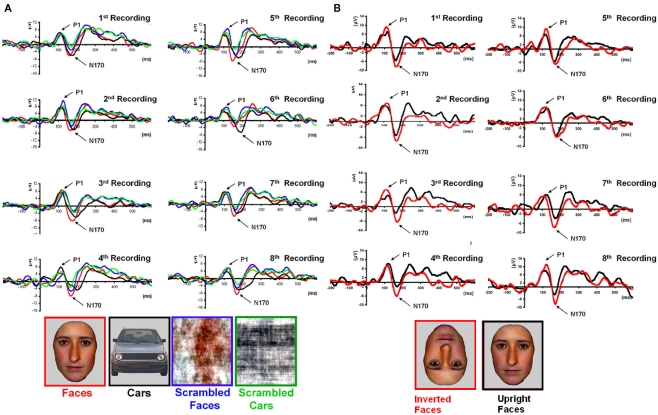
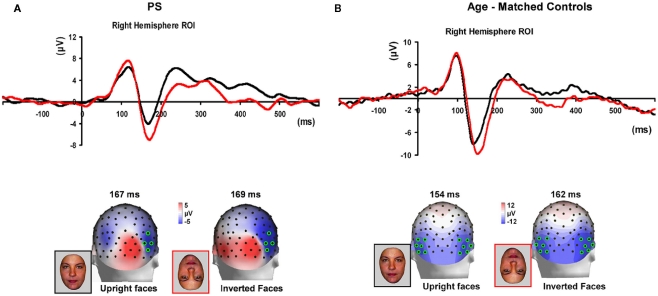
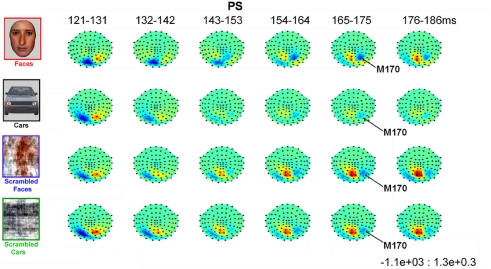
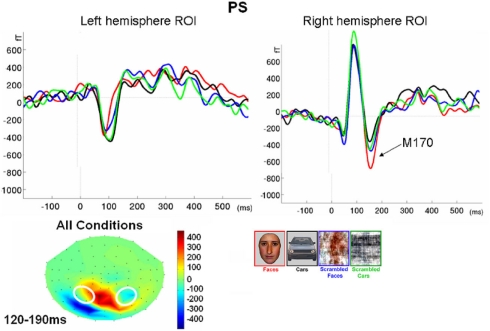
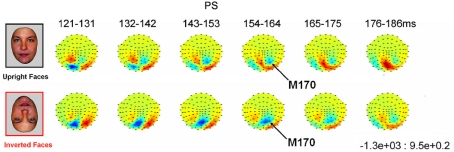
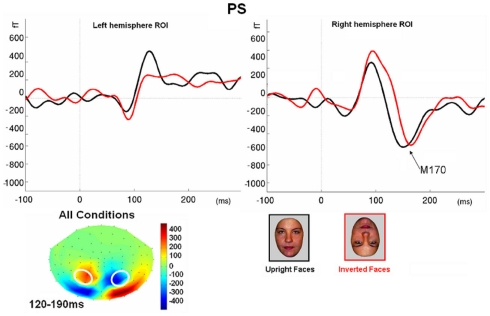
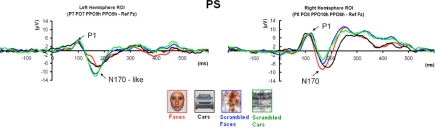
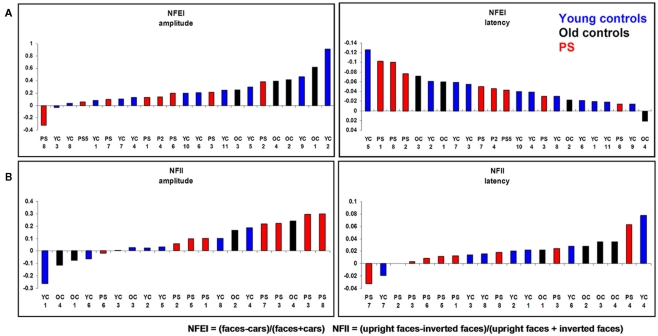
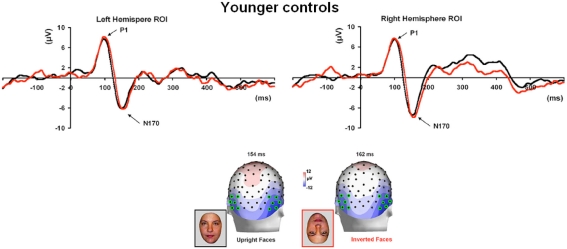
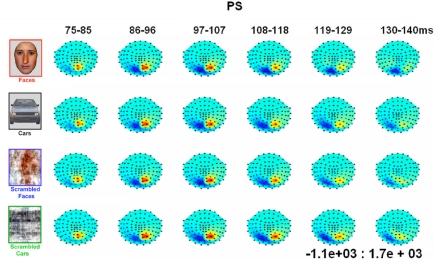
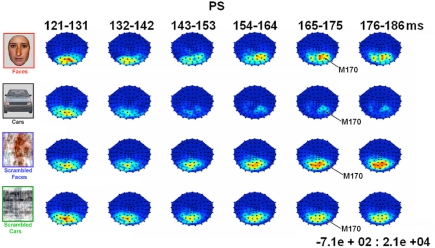
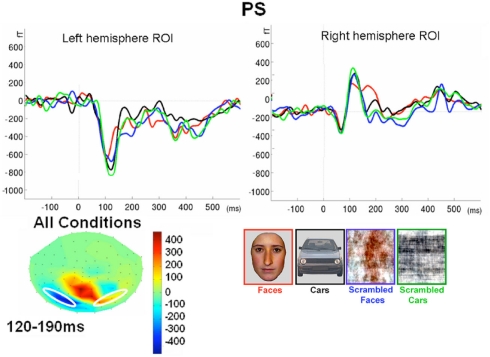
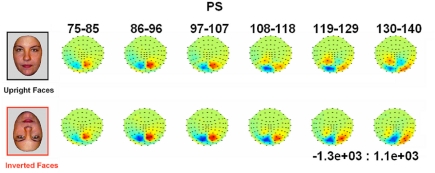
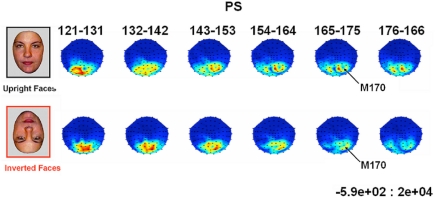
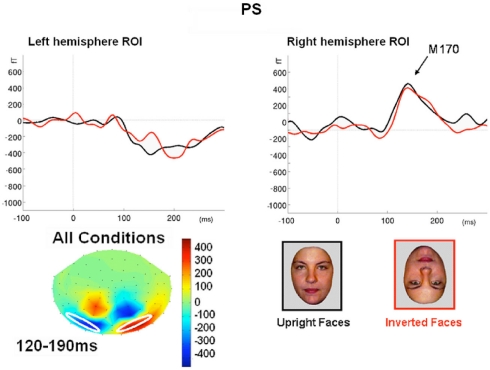
Compared to objects, pictures of faces elicit a larger early electromagnetic response at occipito-temporal sites on the human scalp, with an onset of 130 ms and a peak at about 170 ms. This N170 face effect is larger in the right than the left hemisphere and has been associated with the early categorization of the stimulus as a face. Here we tested whether this effect can be observed in the absence of some of the visual areas showing a preferential response to faces as typically identified in neuroimaging. Event-related potentials were recorded in response to faces, cars, and their phase-scrambled versions in a well-known brain-damaged case of prosopagnosia (PS). Despite the patient's right inferior occipital gyrus lesion encompassing the most posterior cortical area showing preferential response to faces ("occipital face area"), we identified an early face-sensitive component over the right occipito-temporal hemisphere of the patient that was identified as the N170. A second experiment supported this conclusion, showing the typical N170 increase of latency and amplitude in response to inverted faces. In contrast, there was no N170 in the left hemisphere, where PS has a lesion to the middle fusiform gyrus and shows no evidence of face-preferential response in neuroimaging (no left "fusiform face area"). These results were replicated by a magnetoencephalographic investigation of the patient, disclosing a M170 component only in the right hemisphere. These observations indicate that face-preferential activation in the inferior occipital cortex is not necessary to elicit early visual responses associated with face perception (N170/M170) on the human scalp. These results further suggest that when the right inferior occipital cortex is damaged, the integrity of the middle fusiform gyrus and/or the superior temporal sulcus - two areas showing face-preferential responses in the patient's right hemisphere - might be necessary to generate the N170 effect.

Keywords: FFA; N170/M170; OFA; prosopagnosia.


Figures

Figure 1
Figure 1
Brain damage profile of the acquired prosopagnosia patient PS. This patient has damage to the left middle fusiform gyrus and a small lesion to the right middle temporal gyrus, but her main lesion, thought to be instrumental in causing her prosopagnosia, concerns the right inferior occipital cortex (line crossing). This lesion does not prevent a preferential activation for faces in the right middle fusiform gyrus (FFA; here as the result of a combined analysis of six functional localizer runs, contrasting faces and object pictures in a face localizer contrast, see Sorger et al., for details). Although this region responds preferentially to faces, it does not show the normal release to adaptation to different facial identities, in line with the difficulties of the patient in individualizing faces. TRA, transverse plane; COR, coronal plane; SAG, sagittal plane; R, right.
Figure 2
Figure 2
Examples of stimuli and experimental design for the two experiments. (A): Experiment 1, faces vs. objects. (B): Experiment 2, upright vs. inverted faces.
Figure 3
Figure 3
Visual ERPs elicited by all stimulus types in the group of younger controls (A) and age-matched controls (B) highlighting the sensitivity to faces of the P1 and N170 (the ROIs are based on four channels indicated on the topographic maps). Note that the P1 was larger in amplitude both to faces and phase-scrambled faces than to cars and phase-scrambled cars. In contrast, the N170 was small for meaningless (phase-scrambled) stimuli, and showed a larger response to faces than cars.
Figure 4
Figure 4
Evolution of electrophysiological responses to visual stimulation at the back of the head for patient PS. Following visual stimulation, large evoked potentials were recorded on the right posterior medial sites, over PS’ main lesion, with an alternation of negative and positive current flows out of the brain (negative at 75–85 ms, positive at 130–140 ms). These unusual components (indicated in the figure with an asterisk) were most prominent before and after the lateral P1 component. The P1 topography (at the latency at which the component reached its highest amplitude) for the age –matched controls is also shown for comparison.
Figure 5
Figure 5
Waveforms recorded over PS’ scalp following visual stimulation in the four conditions. The waveforms correspond to an average of eight recording sessions (averaged of each session displayed in Figure 6) in which 86 trials were presented for each condition. The first response was identified as a P1, which did not differ much across conditions, but was slightly delayed and larger for scrambled stimuli. The second visual component showed a typical N170 response profile (see the topographic maps displayed at the latency at which the N170 amplitude was highest) only in the right hemisphere (larger response to meaningful stimuli, larger and earlier response to faces than cars). Its topography was slightly different than in normal controls due to the presence of a large unusual visual component recorded on the right posterior medial channels, over the main right hemisphere lesion (indicated in the figure with an asterisk). The “N170-like” component, recorded on electrode sites over the left lateral occipital channels, did not show any of the characteristics associated with an N170, presenting the largest response to phase-scrambled stimuli and the lowest and most delayed response to faces. Different ROIs are presented because the larger response to faces than the other conditions was most pronounced on more anterior lateral channels (B,C) than on channels where all conditions elicited the largest N170 (A).
Figure 6
Figure 6
(A) PS averaged waveforms on the lateral occipital channels that form the regions of interest in the right hemisphere (RH) for each of the eight repetitions of Experiment 1. Despite the relatively low signal-to-noise ratio observed in each of the sessions, most probably due to brain damage, the reliability of the results across sessions with respect to the presence of an N170 in the right hemisphere can be observed. (B). Eight recording sessions of Experiment 2, showing the latency delay and amplitude increase for inverted as compared to upright faces. The latency delay was not present in one of the recording sessions only (seventh), where the preceding component (P1) was substantially delayed for upright faces.
Figure 7
Figure 7
(A) The effect of face inversion on the right N170 for the four age-matched normal controls tested in Experiment 2. The N170 was larger in amplitude and delayed to inverted faces, as previously shown in many studies. (B). The inversion increase and delay as observed on the right hemisphere N170 for PS.
Figure 8
Figure 8
Evolution of magnetic fields evoked by visual stimulation as recorded by 102 magnetometers for patient PS averaged across 10 ms time windows around the M170 component in Experiment 1 (viewed from above, nasion upward; data are interpolated linearly between sensors, indicated by black dots, after their spherical projection onto a 2D surface). Red and blue indicate outward and inward radial direction of magnetic flux through single flux coils within the helmet (in units of fT).
Figure 9
Figure 9
Evoked responses averaged across three channels for the more superior left and right ROIs in Experiment 1 (see Figure A7 in Appendix for more inferior ROIs). These channels were chosen as those with the maximal negative deflection vs. baseline in the right hemisphere from 120 to 190 ms, averaged across conditions, highlighted in white on topography below (these are Neuromag channels “MEG2441,” “MEG2311,” and “MEG2231” for the right ROI, and “MEG1841,” “MEG1631,” and “MEG1911” for the left ROI).
Figure 10
Figure 10
Evolution of magnetic fields evoked by visual stimulation as recorded by 102 magnetometers for patient PS averaged across 10 ms time windows around the M170 component in Experiment 2 (viewed from above, nasion upward; data are interpolated linearly between sensors, indicated by black dots, after their spherical projection onto a 2D surface). Red and blue indicate outward and inward radial direction of magnetic flux through single flux coils within the helmet (in units of fT).
Figure 11
Figure 11
Evoked responses averaged across three channels for the more superior left and right ROIs in Experiment 2 (see Figure A10 in Appendix for more inferior ROIs). These channels were chosen as those with the maximal negative deflection vs. baseline in the right hemisphere from 120 to 190 ms, averaged across conditions, highlighted in white on topography below (these are Neuromag channels “MEG2441,” “MEG2311,” and “MEG2231” for the right ROI, and “MEG1841,” “MEG1631,” and “MEG1911” for the left ROI).
Figure A1
Figure A1
Electrodes layout used for EEG recordings. Back view. The electrodes included in the regions of interest are explicitly indicated.
Figure A2
Figure A2
Grand averaged of all repetitions of the experiment performed by PS but with Fz as a reference.
Figure A3
Figure A3
This figure shows both the mean NFEI [Normalized Face Effect Index = (faces − cars)/(faces + cars)] and the mean NFII [Normalized Face Inversion Index = (inverted faces − upright faces)/(inverted faces + upright faces)] of the individually based analysis for both PS and controls.
Figure A4
Figure A4
Waveforms and topographies of the N170 component of young participants in response to both upright and inverted faces.
Figure A5
Figure A5
Evolution of magnetic fields evoked by visual stimulation as recorded by 102 magnetometers for patient PS averaged across time windows around the M100 component.
Figure A6
Figure A6
Evolution of magnetic fields evoked by visual stimulation as calculated from the root-mean-square (RMS) of signals recorded by each of the two orthogonal planar gradiometers at the 102 locations for patient PS averaged across 10 ms time windows around the M170 component in Experiment 1 (viewed from above, nasion upward; data are interpolated linearly between sensors, indicated by black dots, after their spherical projection onto a 2D surface). Red indicates increased signal magnitude (RMS) relative to pre-stimulus baseline (in units of fT/m).
Figure A7
Figure A7
Evoked responses averaged across three channels for the more inferior left and right ROIs in Experiment 1 (see Figure 9 for more superior ROIs). These channels were chosen as those with the maximal negative deflection vs. baseline in the left hemisphere from 120 to 190 ms, averaged across conditions, highlighted in white on topography below (these are Neuromag channels “MEG2521,” “MEG2321,” and “MEG2341” for the right ROI, and “MEG1641,” “MEG1941,” and “MEG1921” for the left ROI).
Figure A8
Figure A8
Evolution of magnetic fields evoked by visual stimulation as recorded by 102 magnetometers for patient PS averaged across 10 ms time windows around the M100 component in Experiment 2 (viewed from above, nasion upward; data are interpolated linearly between sensors, indicated by black dots, after their spherical projection onto a 2D surface). Red and blue indicate outward and inward radial direction of magnetic flux through single flux coils within the helmet (in units of fT).
Figure A9
Figure A9
Evolution of magnetic fields evoked by visual stimulation as calculated from the root-mean-square (RMS) of signals recorded by each of the two orthogonal planar gradiometers at the 102 locations for patient PS averaged across 10 ms time windows around the M170 component in Experiment 2 (viewed from above, nasion upward; data are interpolated linearly between sensors, indicated by black dots, after their spherical projection onto a 2D surface). Red indicates increased signal magnitude (RMS) relative to pre-stimulus baseline (in units of fT/m).
Figure A10
Figure A10
Evoked responses averaged across three channels for the more inferior left and right ROIs in Experiment 2 (see Figure 11 for more superior ROIs). These channels were chosen as those with the maximal negative deflection vs. baseline in the left hemisphere from 120 to 190 ms, averaged across conditions, highlighted in white on topography below (these are Neuromag channels “MEG2331,” “MEG2511,” and “MEG2521” for the right ROI, and “MEG1931,” “MEG1731,” and “MEG1721” for the left ROI).

References

    1. Allison T., Ginter H., McCarthy G., Nobre A. C., Puce A., Luby M., Spencer D. D. (1994). Face recognition in human extrastriate cortex. J. Neurophysiol. 71, 821–825 - PubMed
    1. Allison T., Puce A., Spencer D. D., McCarthy G. (1999). Electrophysiological studies of human face perception. I: potentials generated in occipitotemporal cortex by face and non-face stimuli. Cereb. Cortex 9, 415–430 10.1093/cercor/9.5.415 - DOI - PubMed
    1. Andrews T. J., Clarke A., Pell P., Hartley T. (2010). Selectivity for low-level features of objects in the human ventral stream. Neuroimage 49, 703–711 10.1016/j.neuroimage.2009.08.046 - DOI - PubMed
    1. Atkinson A. P., Adolphs R. (2011). The neuropsychology of face perception: beyond simple dissociations and functional selectivity. Philos. Trans. R. Soc. Lond. B Biol. Sci. 366, 1726–1738 10.1098/rstb.2010.0349 - DOI - PMC - PubMed
    1. Barton J. J., Press D. Z., Keenan J. P., O’Connor M. (2002). Lesions of the fusiform face area impair perception of facial configuration in prosopagnosia. Neurology 58, 71–78 - PubMed

LinkOut - more resources