

Establishing Communication between Neuronal Populations through Competitive Entrainment
- PMID: 22275892
- PMCID: PMC3257854
- DOI: 10.3389/fncom.2011.00062
Establishing Communication between Neuronal Populations through Competitive Entrainment
Abstract
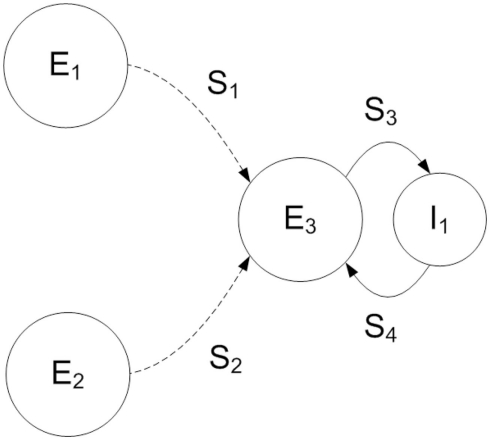
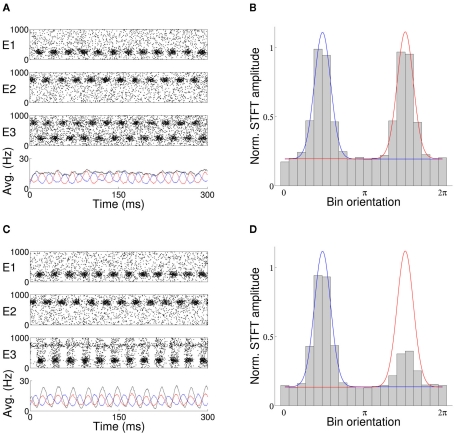
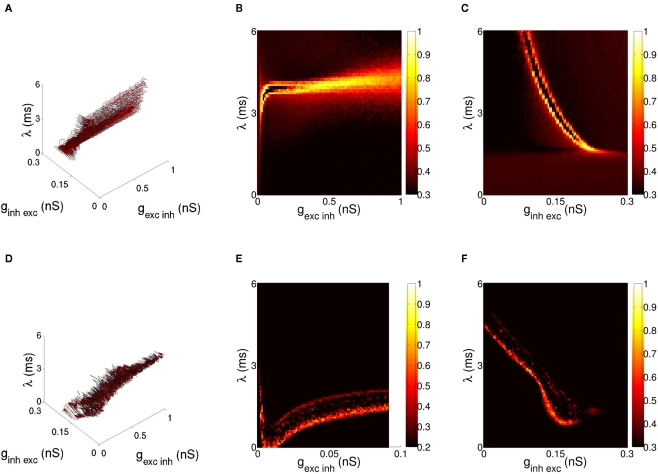
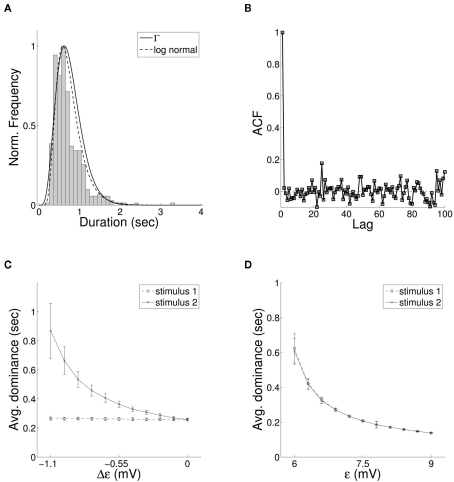
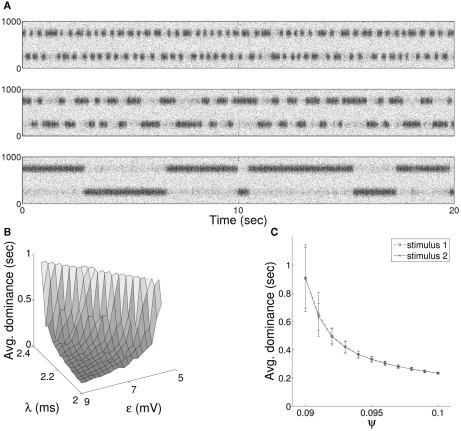
The role of gamma frequency oscillation in neuronal interaction, and the relationship between oscillation and information transfer between neurons, has been the focus of much recent research. While the biological mechanisms responsible for gamma oscillation and the properties of resulting networks are well studied, the dynamics of changing phase coherence between oscillating neuronal populations are not well understood. To this end we develop a computational model of competitive selection between multiple stimuli, where the selection and transfer of population-encoded information arises from competition between converging stimuli to entrain a target population of neurons. Oscillation is generated by Pyramidal-Interneuronal Network Gamma through the action of recurrent synaptic connections between a locally connected network of excitatory and inhibitory neurons. Competition between stimuli is driven by differences in coherence of oscillation, while transmission of a single selected stimulus is enabled between generating and receiving neurons via Communication-through-Coherence. We explore the effect of varying synaptic parameters on the competitive transmission of stimuli over different neuron models, and identify a continuous region within the parameter space of the recurrent synaptic loop where inhibition-induced oscillation results in entrainment of target neurons. Within this optimal region we find that competition between stimuli of equal coherence results in model output that alternates between representation of the stimuli, in a manner strongly resembling well-known biological phenomena resulting from competitive stimulus selection such as binocular rivalry.
Keywords: gamma oscillation; phase coherence; stimulus competition; synchrony.
Figures
Similar articles
-
Analyzing the competition of gamma rhythms with delayed pulse-coupled oscillators in phase representation.Phys Rev E. 2018 Aug;98(2-1):022217. doi: 10.1103/PhysRevE.98.022217. Phys Rev E. 2018. PMID: 30253475
-
Relationship between the mechanisms of gamma rhythm generation and the magnitude of the macroscopic phase response function in a population of excitatory and inhibitory modified quadratic integrate-and-fire neurons.Phys Rev E. 2018 Jan;97(1-1):012209. doi: 10.1103/PhysRevE.97.012209. Phys Rev E. 2018. PMID: 29448391
-
Macroscopic phase resetting-curves determine oscillatory coherence and signal transfer in inter-coupled neural circuits.PLoS Comput Biol. 2019 May 9;15(5):e1007019. doi: 10.1371/journal.pcbi.1007019. eCollection 2019 May. PLoS Comput Biol. 2019. PMID: 31071085 Free PMC article.
-
Interacting competitive selection in attention and binocular rivalry.Prog Brain Res. 2005;149:227-34. doi: 10.1016/S0079-6123(05)49016-0. Prog Brain Res. 2005. PMID: 16226587 Review.
-
Rhythms for Cognition: Communication through Coherence.Neuron. 2015 Oct 7;88(1):220-35. doi: 10.1016/j.neuron.2015.09.034. Neuron. 2015. PMID: 26447583 Free PMC article. Review.
Cited by
-
A model for attentional information routing through coherence predicts biased competition and multistable perception.J Neurophysiol. 2015 Sep;114(3):1593-605. doi: 10.1152/jn.01038.2014. Epub 2015 Jun 24. J Neurophysiol. 2015. PMID: 26108958 Free PMC article.
-
Do gamma oscillations play a role in cerebral cortex?Trends Cogn Sci. 2015 Feb;19(2):78-85. doi: 10.1016/j.tics.2014.12.002. Epub 2014 Dec 30. Trends Cogn Sci. 2015. PMID: 25555444 Free PMC article. Review.
-
Gamma-band synchronization between neurons in the visual cortex is causal for effective information processing and behavior.Nat Commun. 2025 Aug 11;16(1):7380. doi: 10.1038/s41467-025-62732-8. Nat Commun. 2025. PMID: 40790293 Free PMC article.
-
Metastability and inter-band frequency modulation in networks of oscillating spiking neuron populations.PLoS One. 2013 Apr 16;8(4):e62234. doi: 10.1371/journal.pone.0062234. Print 2013. PLoS One. 2013. PMID: 23614040 Free PMC article.
-
Biological oscillations for learning walking coordination: dynamic recurrent neural network functionally models physiological central pattern generator.Front Comput Neurosci. 2013 May 29;7:70. doi: 10.3389/fncom.2013.00070. eCollection 2013. Front Comput Neurosci. 2013. PMID: 23755009 Free PMC article.
References
-
- Ashwin P., Lavric A. (2010). A low-dimensional model of binocular rivalry using winnerless competition. Physica D 239, 529–53610.1016/j.physd.2009.06.018 - DOI
LinkOut - more resources
Full Text Sources