. 2011 Nov 22:5:29.
doi: 10.3389/fninf.2011.00029. eCollection 2011.

Multiscale exploration of mouse brain microstructures using the knife-edge scanning microscope brain atlas

Affiliations

Multiscale exploration of mouse brain microstructures using the knife-edge scanning microscope brain atlas

Ji Ryang Chung et al. Front Neuroinform. .

Abstract

Connectomics is the study of the full connection matrix of the brain. Recent advances in high-throughput, high-resolution 3D microscopy methods have enabled the imaging of whole small animal brains at a sub-micrometer resolution, potentially opening the road to full-blown connectomics research. One of the first such instruments to achieve whole-brain-scale imaging at sub-micrometer resolution is the Knife-Edge Scanning Microscope (KESM). KESM whole-brain data sets now include Golgi (neuronal circuits), Nissl (soma distribution), and India ink (vascular networks). KESM data can contribute greatly to connectomics research, since they fill the gap between lower resolution, large volume imaging methods (such as diffusion MRI) and higher resolution, small volume methods (e.g., serial sectioning electron microscopy). Furthermore, KESM data are by their nature multiscale, ranging from the subcellular to the whole organ scale. Due to this, visualization alone is a huge challenge, before we even start worrying about quantitative connectivity analysis. To solve this issue, we developed a web-based neuroinformatics framework for efficient visualization and analysis of the multiscale KESM data sets. In this paper, we will first provide an overview of KESM, then discuss in detail the KESM data sets and the web-based neuroinformatics framework, which is called the KESM brain atlas (KESMBA). Finally, we will discuss the relevance of the KESMBA to connectomics research, and identify challenges and future directions.

Keywords: Golgi; Knife-Edge Scanning Microscopy; connectomics; mouse brain; multiscale; web-based brain atlas.


Figures

Figure 1
Figure 1
The knife-edge scanning microscope and its operation. (A) The Knife-Edge Scanning Microscope and its main components are shown: (1) high-speed line-scan camera, (2) microscope objective, (3) diamond knife assembly and light collimator, (4) specimen tank (for water immersion imaging), (5) three-axis precision air-bearing stage, (6) white-light microscope illuminator, (7) water pump (in the back) for the removal of sectioned tissue, (8) PC server for stage control and image acquisition, (9) granite base, and (10) granite bridge. (B) The imaging principle of the KESM is shown.
Figure 2
Figure 2
Transparent overlay with distance attenuation. (A) An image stack containing two intertwined objects are shown. (B) Simple overlay of the image stack in (A) results in loss of 3D perspective. (C) Overlay with distance attenuation helps bring out the 3D cue.
Figure 3
Figure 3
Multiscale tiling. (A) Tile pyramid compatible with GoogleMaps. Quad-tree pyramid of tiles and the x-y coordinate indexing convention are depicted. Each tile has 256 × 256 pixels. Zoom level ranges from 0 to 7, and zoom level N has 2N × 2N tiles. Following this tiling convention automatically enables various map functions including zoom-in/out. (B) Example of actual tiles. The maximum zoom level of the Golgi image section (19,200 × 12,000 pixels) is 7 [=argminx (256 × 2x ≥ max(19200,12000))]. The minimum zoom level is set to 2. This particular example shows how the original image is tiled and how the tiles are named at zoom level 2. The dark image in the middle is the image section halved down 5 times (600 × 375 pixels) to fit in zoom level 2 (1,024 × 1,024 pixels). After putting the downsized image at the center, transparent image patches (gray dashed area) are added to fill the incomplete tiles so that every tile can have the same 256 × 256 pixels size. Because there is no need to generate empty tiles, only 8 tiles are created out of 16 possible ones.
Figure 4
Figure 4
KESM brain atlas interface. A screenshot of the KESM brain atlas running in a web browser is shown. Red markers and text were added on top for the purpose of explanation, below. (A) Navigation panel: panning and zoom-in/zoom-out. (B) Data set selection. Golgi, Golgi2, India Ink are available in the pull-down menu. (C) Sectioning plane orientation. Three standard planes supported (planned). (D) Depth navigation. Amount of movement (unit = 1 μm) in the z direction and forward (deeper, [+]) or backward (shallower, [−]) can be controlled. (E) Overlay count. How many images to overlay can be selected here. (F) Overlay interval. For high zoom-out levels, overlaying every n images is enough, and this helps visualize thicker sections. (G) Information window containing specimen meta data and current location information. (H) Scale bar that automatically adjust to the given zoom level. (I) Main display. Note that the Google logo on the bottom left is shown due to the use of the Google Maps API, and it by no means indicate any connection between the KESM data and Google.
Figure 5
Figure 5
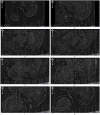
Golgi data set 1. A fly-through of the Golgi data set 1 is shown. The data were obtained by sectioning in the horizontal plane (upper right corner: anterior, lower left corner: posterior). This is the full extent of the data that was captured. We can see that part of the left temporal lobe, left frontal lobe, and part of the right frontal lobe are cut off. Scale bar = 1 mm. Each image is an overlay of 20 images in the z direction. The z-interval between each panel is 600 μm. The numbers below the panels show the ordering. These are cropped screenshots from the KESMBA. This data set, obtained in 2008, is the first whole-brain-scale data set of the mouse at sub-micrometer resolution.
Figure 6
Figure 6
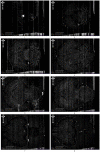
Golgi data set 2. A fly-through of the Golgi data set 2 is shown. The data were obtained by sectioning in the horizontal plane (left: anterior, right: posterior). Scale bar = 1 mm. Each image is an overlay of 20 images in the z direction. The z-interval between each panel is 800 μm, except for the last where it was 200 μm (so that data from near the bottom of the data stack can be shown: otherwise it will overshoot into regions with no data). The numbers below the panels show the ordering. See Movie S1 in Supplementary Material for a fly-through of this data set.
Figure 7
Figure 7
Golgi data set 2, Coronal and Sagittal Views. The coronal (A) and sagittal (B) views of the data set in Figure 6 are shown. Scale bar = 1 mm. These views show the superior z-axis resolution of the KESM data sets.
Figure 8
Figure 8
Details from Golgi data set 1. Details from the Golgi data set 1 are shown at full resolution. This panel shows an overlay of 20 images, thus it is showing a 20-μm-thick volume. Scale bar = 100 μm. The arrow heads, from left to right, point to (1) the soma of a pyramidal cell in the cortex and (2) its apical dendrite, and (3) a couple of spiny stellate cells. Other pyramidal cells and stellate cells can be seen in the background. At this resolution, we can see dendritic spines as well.
Figure 9
Figure 9
Effectiveness of image overlays. The effect of an increasing number of overlays is shown. Scale bar = 100 μm. The data is from the same region as that from Figure 8. (A) Since each KESM image corresponds to a 1-μm-thick section, a single image conveys little information about the neuronal morphology. (B) Five overlayed images, corresponding to a 5-μm-thick section, begins to show some structure but it is not enough. (C) With twenty overlayed images, familiar structures begin to appear. (D,E) At a zoomed-out scale, skipping over images can be an effective strategy to view the circuits more clearly. In (D), 20 overlays at an interval of 1, representing a 20-μm-thick volume is shown. In (E), 20 overlays at an interval of 5 is shown, representing 100 μm. The dense dendritic arbor in the hippocampus (left), fiber tract projecting toward the hippocampal commissure (middle, top), and the massive number of pyramidal cells and their apical dendrites (right) are clearly visible only in (E).
Figure 10
Figure 10
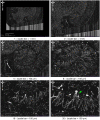
Multiscale view of the KESMBA. A multiscale view of the KESMBA is shown (Golgi data set 1), by gradually zooming into the hippocampus (the numbers below the panels show the zoom-in sequence). All panels show an overlay of 20 sections. The first four panels are shown with an overlay interval of 5 and the last two with an interval of 1. Axons emerging from the hippocampal neurons are clearly visible (arrow head, last panel).
Figure 11
Figure 11
Different types of local circuits. Different types of local circuits from the KESM Golgi data set 1 are shown. (A) Cerebellum. (B) Inferior colliculus. (C) Thalamus. (D) Hippocampus (also see Figure 10). See Figure 8 for circuits in the neocortex. Scale bar = 100 μm. See Movie 2 in Supplementary Material (cerebellum, colliculi) and Movie 3 in Supplementary Material (hippocampus).
Figure 12
Figure 12
System-level fiber tracts in the KESM Golgi data set 2. (A) Horizontal section at the level of the anterior commissure (the “)”-shaped fiber bundle) is shown (left: anterior, right: posterior). Massive fiber tracts in the striatum can also be observed. (B,C) Zoomed in view showing the anterior commissure near the middle. (D) Close-up of the fiber bundles in the striatum can be seen. A large number of apical dendrites in the adjoining cortex can also be seen.
Figure 13
Figure 13
KESMBA download performance analysis. Average of 10 download trials for each setting (browser type and overlay size) is plotted (error bars indicate standard deviation). IE, internet explorer, FF, firefox. Except for the case of Mozilla Firefox downloading 20 overlays, both the Intranet and Internet downloading times increased proportionally with the overlay size.
Figure 14
Figure 14
From image to geometry. (A) A portion of KESM Golgi data set 1 is shown (cortex). Maximum intensity projection is used to show a thicker section containing a large number of neurons. Scale bar = 100 μm. (B) Semi-automated 3D reconstruction results are shown (partial results, using Neuromantic, Myatt and Nasuto, 2007).

Similar articles

Cited by

References

    1. Abbott L. C. (2008). “High-throughput imaging of whole small animal brains with the knife-edge scanning microscope,” in Neuroscience Meeting Planner, Program No. 504.2. Washington, DC: Society for Neuroscience
    1. Abbott L. C., Sotelo C. (2000). Ultrastructural analysis of catecholaminergic innervation in weaver and normal mouse cerebellar cortices. J. Comp. Neurol. 426, 316–32910.1002/1096-9861(20001016)426:2<316::AID-CNE11>3.3.CO;2-# - DOI - PubMed
    1. Al-Kofahi K. A., Lasek S., Szarowski D. H., Pace C. J., Nagy G., Turner J. N., Roysam B. (2002). Rapid automated three-dimensional tracing of neurons from confocal image stacks. IEEE Trans. Inf. Technol. Biomed. 6, 171–18710.1109/TITB.2002.1006304 - DOI - PubMed
    1. Ascoli G., Krichmar J., Scorcioni R., Nasuto S., Senft S. (2001). Computer generation and quantitative morphometric analysis of virtual neurons. Anat. Embryol. (Berl.) 204, 283–30110.1007/s004290100201 - DOI - PubMed
    1. Ascoli G. A., Donohue D. E., Halavi M. (2007). NeuroMorpho.Org: a central resource for neuronal morphologies. J. Neurosci. 27, 9247–925110.1523/JNEUROSCI.2055-07.2007 - DOI - PMC - PubMed