. 2012 Jan 13:2:96.
doi: 10.3389/fphar.2011.00096. eCollection 2011.

Aerobic production and utilization of lactate satisfy increased energy demands upon neuronal activation in hippocampal slices and provide neuroprotection against oxidative stress

Affiliations

Aerobic production and utilization of lactate satisfy increased energy demands upon neuronal activation in hippocampal slices and provide neuroprotection against oxidative stress

Avital Schurr et al. Front Pharmacol. .

Abstract

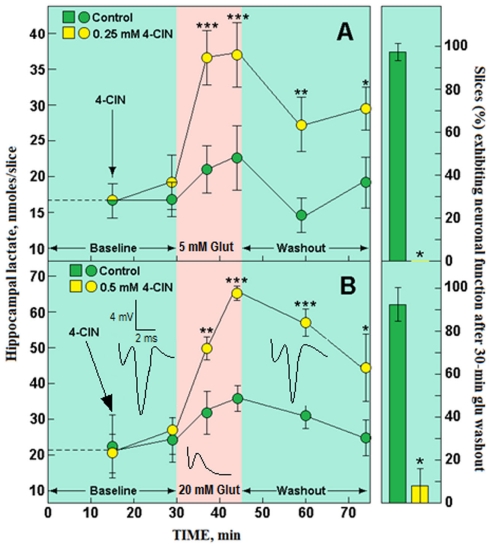
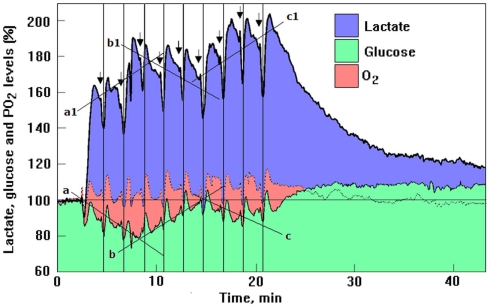
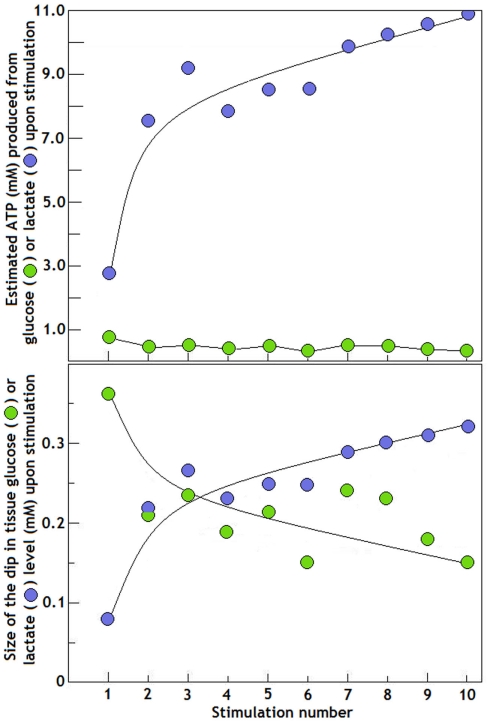
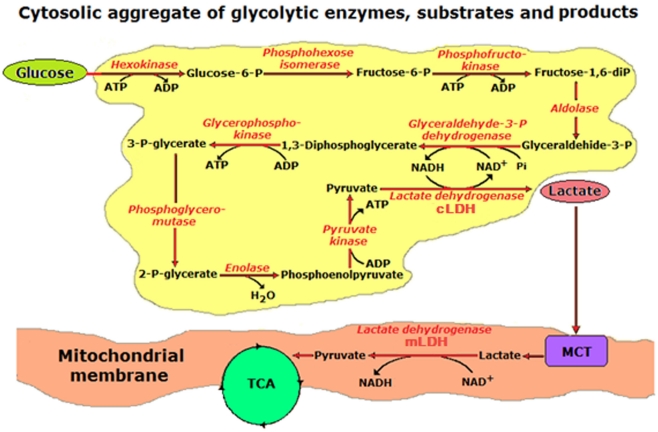
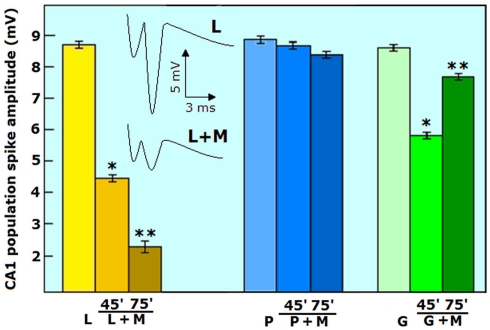
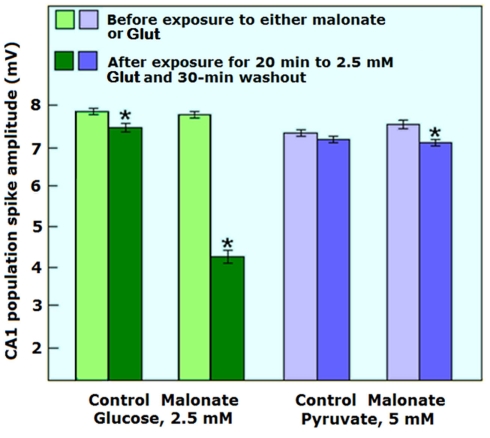
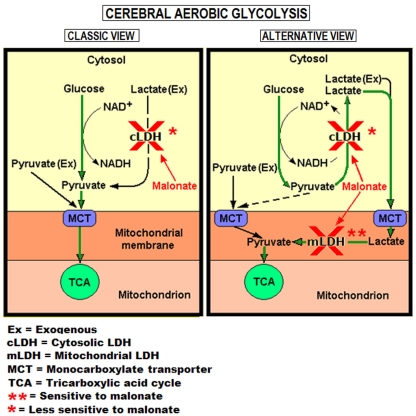
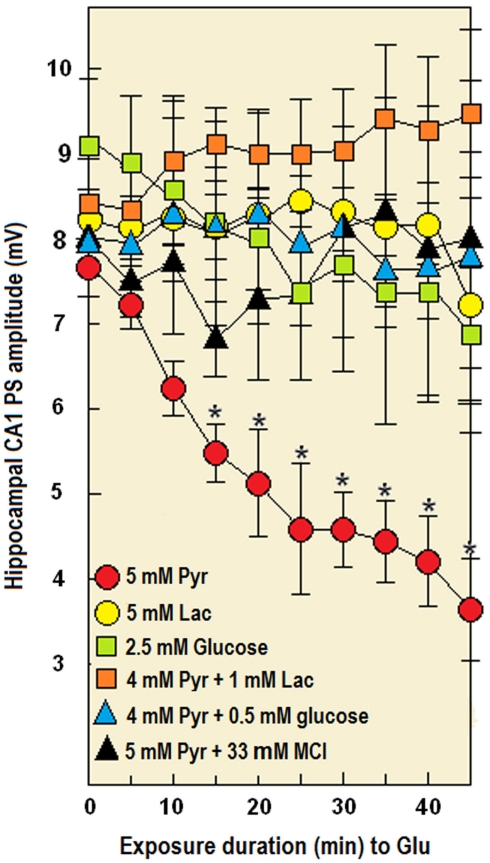
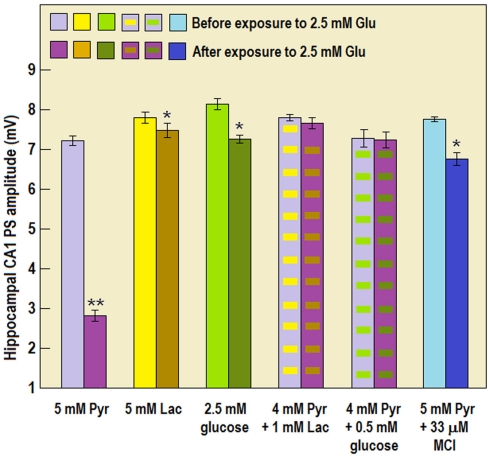
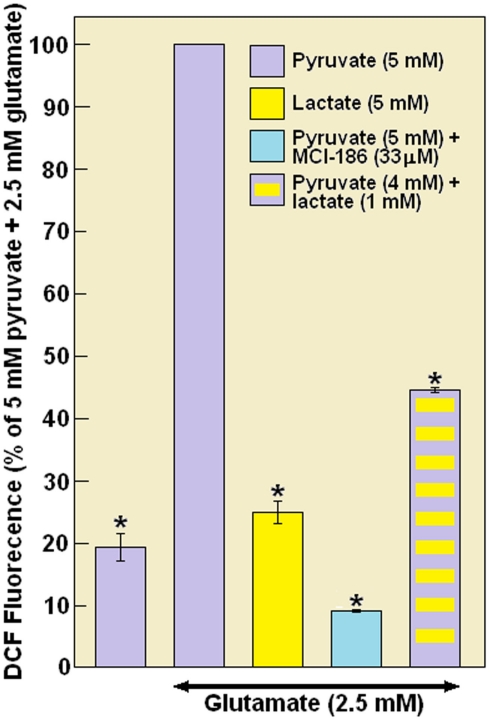
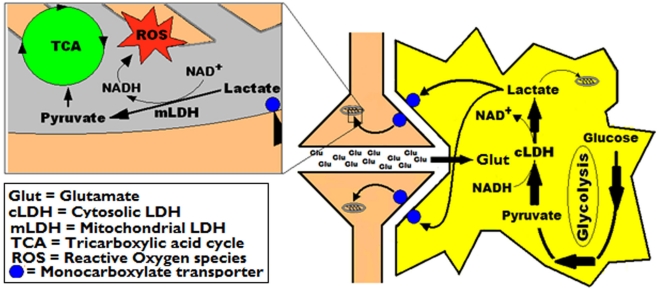
Ever since it was shown for the first time that lactate can support neuronal function in vitro as a sole oxidative energy substrate, investigators in the field of neuroenergetics have been debating the role, if any, of this glycolytic product in cerebral energy metabolism. Our experiments employed the rat hippocampal slice preparation with electrophysiological and biochemical methodologies. The data generated by these experiments (a) support the hypothesis that lactate, not pyruvate, is the end-product of cerebral aerobic glycolysis; (b) indicate that lactate plays a major and crucial role in affording neural tissue to respond adequately to glutamate excitation and to recover unscathed post-excitation; (c) suggest that neural tissue activation is accompanied by aerobic lactate and NADH production, the latter being produced when the former is converted to pyruvate by mitochondrial lactate dehydrogenase (mLDH); (d) imply that NADH can be utilized as an endogenous scavenger of reactive oxygen species (ROS) to provide neuroprotection against ROS-induced neuronal damage.

Keywords: LDH; NADH; glycolysis; hippocampal slice; lactate; neuronal function; neuroprotection; reactive oxygen species.


Figures

Figure 1
Figure 1
The effect of 15 min exposure to glutamate (Glut) on the ability of hippocampal slices to recover their neuronal function following a 30 min Glut washout and on the content of tissue lactate at several time points during two experimental paradigms. (A) Perfusion of slices with 4 mM glucose aCSF for 30 min, followed by a 15 min exposure to 5 mM Glut, followed by a 30 min washout with 4 mM glucose aCSF, either in the presence of 0.25 mM 4-CIN (yellow symbols) or in the absence of 4-CIN (green symbols); (B) perfusion of slices with 10 mM glucose aCSF, followed by a 15 min exposure to 20 mM Glut, followed by a 30 min washout with 10 mM glucose aCSF in the presence of 0.5 mM 4-CIN (yellow symbols) or in the absence of 4-CIN (green symbols). Also shown are sample traces of PS recorded from one hippocampal slice before and during exposure to 20 mM Glut and after Glut washout. Each data point was repeated three times (30–36 slices over all). Bars are means ± SD; significantly different from control (*p < 0.003; **p < 0.01; ***p < 0.004). For additional methodological details see Schurr et al., 1999a,b).
Figure 2
Figure 2
Profiles of time course and dynamic relationships of local extracellular lactate, glucose, and PO2 levels in the rat hippocampal dentate gyrus during a series of 5 s electrical stimulations (arrows) of the perforant pathway at 2 min rest intervals (reproduced with permission from Hu and Wilson, ; copyright 1997, Blackwell, Oxford). The different diagonal lines show the trend in the mean analyte concentration during the series of stimulations. During the second to the fourth stimulations as glucose mean level gradually decreased (line a), lactate mean level gradually increased (line a1). During the next three stimulations the trend was inverted (lines b and b1) and during the 7th to the 10th stimulations the trend inverted itself again (lines c and c1). The changes in the mean concentration of glucose were always in opposite direction to the changes in mean lactate concentration. The vertical lines were drawn to indicate the simultaneous dip in all three analytes in response to each of the 10 electrical stimulations. For additional details see Hu and Wilson (1997b).
Figure 3
Figure 3
The time course of changes in the amplitude of the dip in tissue glucose and lactate levels in the rat hippocampal dentate gyrus after each of the 10 electrical stimulations applied to the perforant pathway at intervals of 2 min (bottom panel). The amplitude of each dip (in mM) was calculated from the data of Hu and Wilson (1997b) as reproduced in Figure 2. The upper panel illustrates the estimated ATP amount produced based on the size of the dip (in mM) in tissue glucose and lactate levels as shown in the bottom panel. The estimated ATP levels were calculated as follows: the glucose measured dip (in mM) was multiplied by 2, which is the net formation of 2 mol of ATP for each mole of glycolytically metabolized glucose; the lactate measured dip (in mM) was multiplied by 34, which is the net formation of 34 mol of ATP for every 2 mol of lactate (formed glycolytically from 1 mol of glucose) metabolized via the mitochondrial TCA and the oxidative phosphorylation chain.
Figure 4
Figure 4
A schematic illustration of a hypothesis first presented elsewhere (Schurr, 2006), postulating lactate, not pyruvate, to be the end-product of aerobic glycolysis. This hypothesis is founded on thermodynamic and other considerations, including data from many studies spanning almost eight decades of research by scientists in laboratories all around the world. The illustration shows the glycolytic apparatus as an aggregate of the glycolytic enzymes, all in close proximity to each other, as required by such a pathway for a maximized efficient output, with the entry of glucose into this pathway on the upper left side and an exit of lactate from the pathway on the right side through the action of cytosolic lactate dehydrogenase (cLDH). Lactate is shuttled via an intracellular shuttle to the mitochondrial membrane, where it is converted back into pyruvate via mitochondrial lactate dehydrogenase (mLDH) and into the tricarboxylic acid (TCA) cycle.
Figure 5
Figure 5
The effect of the LDH inhibitor, malonate (M, 10 mM) on evoked CA1 population spike amplitude (neuronal function) of rat hippocampal slices maintained is aCSF containing either lactate (L, 5 mM), pyruvate (P, 5 mM), or glucose (G, 2.5 mM). Malonate progressively inhibited lactate-supported neuronal function over time and was innocuous against pyruvate-supported neuronal function. Malonate initially inhibited glucose-supported neuronal function, inhibition that was later mostly relieved. Each data point was repeated three times (30–36 slices over all). Bars are means ± SEM; *significantly different from energy substrate alone; **significantly different from energy substrate or energy substrate + malonate at 45 min (p < 0.0001). For additional methodological details see Schurr and Payne (2007).
Figure 6
Figure 6
The effect of 20 min exposure to glutamate (Glut, 2.5 mM) on hippocampal CA1 evoked population spike (PS, neuronal function) in the absence or presence of the LDH inhibitor, malonate (10 mM) when either glucose (2.5 mM) or pyruvate (5 mM) was the sole energy substrate. Slices maintained in glucose aCSF could not recover their PS amplitude following Glut washout in the presence of malonate as compared to those maintained in the absence of malonate or those maintained with pyruvate whether malonate was absent or present. Slices were exposed to malonate throughout the experimental protocol for a total of 80 min (30 min before the exposure to Glut, 20 min during the exposure to Glut and 30 min during Glut washout). Each data point was repeated three times (30–36 slices). Bars are means ± SEM; *significantly different from the mean values before exposure to either malonate or Glut (p < 0.01). For additional methodological details see Schurr and Payne (2007).
Figure 7
Figure 7
Two views of aerobic glycolysis. The classic view depicts pyruvate as the glycolytic pathway’s end-product (green arrows, left panel) and thus as the pathway that should not be affected by an LDH inhibitor such as malonate in supplying pyruvate to mitochondria. The results shown in Figures 5 and 6 cannot be explained by this view. The alternative view of the aerobic glycolytic pathway postulates lactate to be its end-product (green arrows, right panel, Schurr, 2006). Since glycolytically produced lactate must be converted to pyruvate to allow the latter to enter the TCA cycle, this alternative view explains the ability of malonate to interfere with glucose-supported neuronal function as shown in Figure 5 (right side histograms). However, over time, malonate’s weaker inhibiting activity of the reaction converting pyruvate to lactate shifts the glycolytic conversion of glucose from lactate to pyruvate until the latter becomes the main glycolytic end-product and the mitochondrial substrate (broken arrow, right panel), relieving the suppression of neuronal function observed earlier when glucose is the energy substrate (Figure 5).
Figure 8
Figure 8
The time-dependent effect of Glut (2.5 mM) on the amplitude of electrically evoked CA1 population spike (PS, neuronal function) in rat hippocampal slices perfused with either 5 mM pyruvate (Pyr), 5 mM lactate (Lac), a mixture of pyruvate (4 mM) with lactate (1 mM), or MCI-186 (33 μM, MCI). Pyruvate alone could not support neuronal function in the presence of glutamate, but mixing this monocarboxylate with a low concentration of either lactate, glucose, or MCI-186 overcame this inability. Each point is the mean amplitude value recorded from three separate hippocampal slices prepared from three different rat brains. Bars are SE of the mean. *Significantly different from the PS amplitude in slices perfused with pyruvate in the absence of glutamate (p < 0.02).
Figure 9
Figure 9
The mean, electrically evoked, population spike (PS, neuronal function) amplitude in rat hippocampal slices perfused for at least 45 min with aCSF containing either 5 mM pyruvate (Pyr), 5 mM lactate (Lac), 2.5 mM glucose, 4 mM Pyr + 1 mM Lac, 4 mM Pyr + 0.5 mM glucose, or 5 mM Pyr + 33 μM MCI-186 (MCI) in the absence or presence of 2.5 mM Glut. Pyruvate alone could not sustain neuronal function in the presence of Glut. Pyruvate inability to sustain normal neuronal function during exposure to Glut appears to be in contrast to the results shown in Figure 6. However, the difference stems from the fact that in this set of experiments slices were exposed to Glut for 45 min, while in the experiments described in Figure 6 they were exposed to Glut for only 20 min. All other treatments overcame the excitotoxicity of Glut. Each column is the mean PS amplitude recorded from at least 23 slices prepared from at least three different rat brains. Bars are SE of the mean. *Significantly different from the PS amplitude in control slices not exposed to Glut (p < 0.004); **significantly different from the PS amplitude in control slices not exposed to Glut (p < 0.00006).
Figure 10
Figure 10
The level of reactive oxygen species (ROS) as measured using the fluorescence of dichlorofluorescein (DCF) extracted from slices perfused with aCSF containing glutamate (2.5 mM) and either pyruvate (5 mM), lactate (5 mM), the combination of [pyruvate (4 mM) + lactate (1 mM)], or the combination of [pyruvate (5 mM) + MCI-186 (33 μM)] (see details in Materials and Methods). Also shown is a set of experiments in which Glut was omitted from the aCSF of pyruvate-supplemented slices. Glut-treated, lactate-, or MCI-186-supplemented slices exhibited significantly lower levels of ROS than pyruvate-supplemented, Glut-treated slices. Each sample for measurement of fluorescence used five slices and was prepared in duplicates. Measurements were repeated at least three times. Bars are SE of the mean. *Significantly different from pyruvate + Glut (p < 0.05).
Figure 11
Figure 11
A simplified schematic representation of the astrocytic-neuronal lactate shuttle hypothesis (ANLSH, Pellerin and Magistretti, 1994) combined with our own hypothesis that postulates lactate as the end-product of aerobic glycolysis (Figures 4 and 7). In addition, the left panel illustrate the ability of NADH, formed during lactate conversion to pyruvate in the neuronal mitochondrial membrane, to neutralize Glut-induced ROS-produced damage.

Similar articles

Cited by

References

    1. Aliprandi A., Longoni M., Stanzani L., Remolizzo L., Vaccaro M., Begni B., Galimberti G., Garofolo R. (2005). Increased plasma glutamate in stroke patients might be linked to altered platelet release and uptake. J. Cereb. Blood Flow Metab. 25, 513–51910.1038/sj.jcbfm.9591524.0513 - DOI - PubMed
    1. Aliverdieva D. A., Manaev D. V., Bondarenko D. I., Sholtz K. F. (2006). Properties of yeast Saccharomyces cerevisiae plasma membrane dicarboxylate transporter. Biochemistry (Mosc.) 71, 1161–116910.1134/S0006297906010056 - DOI - PubMed
    1. Ashford C. A., Holmes E. G. (1929). Contributions to the study of brain metabolism. V. Role of phosphates in lactic acid production. Biochem. J. 23, 748–759 - PMC - PubMed
    1. Ashford C. A., Holmes E. G. (1931). Further observations on the oxidation of lactic acid by brain tissue. Biochem. J. 25, 2028–2049 - PMC - PubMed
    1. Atlante A., de Bari L., Bobba A., Marra E., Passarella S. (2007). Transport and metabolism of l-lactate occur in mitochondria from cerebellar granule cells and are modified in cells undergoing low potassium dependent apoptosis. Biochim. Biophys. Acta 1767, 1285–129910.1016/j.bbabio.2007.08.003 - DOI - PubMed

LinkOut - more resources