. 2010:4:164.
doi: 10.3332/ecancer.2010.164. Epub 2010 Feb 3.

The role of funding and policies on innovation in cancer drug development

Affiliations

The role of funding and policies on innovation in cancer drug development

P Kanavos et al. Ecancermedicalscience. 2010.
No abstract available


Figures

Figure 1.1:
Figure 1.1:. Cancer related deaths and burden of disease grouped by income per capita (2004)
Source: [4].
Figure 1.2:
Figure 1.2:
Global R&D expenditure, development times, NME output and global pharmaceutical sales (1997–2007) Notes: Each trend line has been indexed to 1997 values Development time data point for 2007 includes data from 2006 and 2007 only Source: CMR International and IMS Health
Figure 1.3:
Figure 1.3:
Number of new cancer drugs in development by type of cancer. Note: Some drugs are listed in more than one category. Source: PhRMA (‘New medicines in development for cancer’).
Figure 3.1:
Figure 3.1:
The public-private interface in cancer drug research and development. Source: The authors.
Figure 3.2:
Figure 3.2:
Number of public sector funding organisations by country. Source: The authors.
Figure 3.3:
Figure 3.3:
Direct cancer drug R&D (Spending on log scale). Source: The authors.
Figure 3.4:
Figure 3.4:
Estimated indirect cancer R&D funding.
Figure 3.5:
Figure 3.5:
Cancer R&D direct spending (€) per capita. Source: The authors.
Figure 3.6:
Figure 3.6:
Direct cancer R&D spending per capita, 2004 versus 2007 (€). Source: ECRM (2004 data) and the Authors (2007 data).
Figure 3.7:
Figure 3.7:
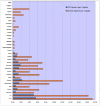
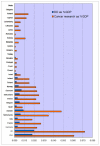
Cancer drug R&D and cancer R&D direct spending, % of GDP. Source: The authors.
Figure 3.8:
Figure 3.8:
Route of cancer drug R&D funding. Source: The authors.
Figure 3.9:
Figure 3.9:
Cancer drug R&D spend per capita (€). Source: The authors.
Figure 3.10:
Figure 3.10:
Cancer drug R&D spend, % of GDP. Source: The authors.
Figure 3.11:
Figure 3.11:
European cancer R&D spend by CSO category. Source: The authors.
Figure 3.12:
Figure 3.12:
Number of active cancer drug development projects by funder, grouped by country (log scale). Source: The authors.
Figure 3.13:
Figure 3.13:
Scatter plot showing percentage of spend according to domain of research (by CSO category) for a sample of European Cancer Centres (n= 20). Source: The authors.
Figure 3.14:
Figure 3.14:
Drug R&D funding by charities and government (2007). Source: The authors.
Figure 3.15:
Figure 3.15:
Percent of direct spend by political group in Europe (2007). Source: The authors.
Figure 3.16:
Figure 3.16:
Private cancer drug development spend: major pharmaceutical companies (2004/ Phase III)* Note: *The figure does not include all industry (e.g. SME and biotechnology). Source: [7].
Figure 3.17:
Figure 3.17:
Private cancer R&D funding by company origin. Source: The authors.
Figure 3.18:
Figure 3.18:
Cancer drug development projects with joint private-public funding (%) (2007–2008). Source: The authors.
Figure 3.19:
Figure 3.19:
Interaction between basic versus applied science and between market versus government. Source: Adapted from [].
Figure 4.1:
Figure 4.1:
Total WoS output for 19 cancer drug research papers (3-year running means) (1970–2007)
Figure 4.2:
Figure 4.2:
Proportion of total drug (blue) and 19 drugs (red) cancer research papers of total cancer research papers
Figure 4.3:
Figure 4.3:
WoS cancer drug papers for 19 cancer drugs (1963–2009)
Figure 4.4:
Figure 4.4:
Distribution of papers in 15 countries (integer, fractional counts)
Figure 4.5:
Figure 4.5:
Cancer drug paper outputs (1994–2008) versus cancer burden of disease (% DALYs) (2004) (weighted by the countries’ presence in cancer drug research)
Figure 4.6:
Figure 4.6:
Country-specific correlation coefficient of cancer drug paper outputs versus burden for 16 cancer sites
Figure 4.7:
Figure 4.7:
China: cancer drug research output versus burden from 16 cancer sites
Figure 4.8:
Figure 4.8:
Mean research level (RL) of all cancer drug papers in five quintiles
Figure 4.9:
Figure 4.9:
Mean research level (RL): journal source (RLj) versus title source (RLp) in 19 cancer drug papers (1963–2009)
Figure 4.10:
Figure 4.10:
Average research level (RL) per time quintile for 6 cancer drugs
Figure 4.11:
Figure 4.11:
Mean research level (RL) from 15 countries in 19 cancer drug research papers per paper title (paper) and per journal source (journal)
Figure 4.12:
Figure 4.12:
Phased carboplatin clinical trials longitudinal paper outputs (3-year running means)
Figure 4.13:
Figure 4.13:
Percentage cancer drug clinical trials output per mean research level in 15 countries
Figure 4.14:
Figure 4.14:
Geographical distribution of cancer drug papers in three world regions (USA, EUR 30, RoW) (quintiles, fractional counts) (1963–2009)
Figure 4.15:
Figure 4.15:
Chinese cancer drug papers, 3-year running means (fractional counts) (1996–2008)
Figure 4.16:
Figure 4.16:
Distribution of 19 cancer drug papers by geographical region: USA, EUR30 and RoW (fractional counts)
Figure 4.17:
Figure 4.17:
Funding sources in 19 cancer drug papers (1963–2009)
Figure 4.18:
Figure 4.18:
Funding sources for 6 out of 19 cancer drugs* in different time quintiles *Six drugs = carboplatin, cisplatin, docetaxel, irinotecan, tamoxifen and vincristine.
Figure 4.19:
Figure 4.19:
Funding sources for cancer drug papers in 15 leading countries (1963–2009)
Figure 5.1:
Figure 5.1:
Is private sector support for drug development essential?
Figure 5.2:
Figure 5.2:
Is the current level of national public sector investment adequate?
Figure 5.3:
Figure 5.3:
Does the public sector have a limited role in cancer drug development?
Figure 5.4:
Figure 5.4:
How important is the intellectual (academic faculty) environment?
Figure 5.5:
Figure 5.5:
Are financial incentives important for public-private partnerships?
Figure 5.6:
Figure 5.6:
Should private sector support be short-term project based?
Figure 5.7:
Figure 5.7:
Should nationalisation of parts of the drug development process be considered?
Figure 5.8:
Figure 5.8:
Is the balance between private and public cancer drug development correct?
Figure 5.9:
Figure 5.9:
Is the regulatory environment a key area for success?
Figure 5.10:
Figure 5.10:
How important are policies around the reimbursement of new cancer drugs to future success?
Figure 5.11:
Figure 5.11:
How important are supra-national funding initiatives?
Figure 5.12:
Figure 5.12:
How important are national funding policies from research funding organisations?
Figure 5.13:
Figure 5.13:
Is institutional support important for success in cancer drug discovery?
Figure 5.14:
Figure 5.14:
Are technology transfer and/or incentive schemes important policy areas?
Figure 5.15:
Figure 5.15:
Are new models in PPP are needed?
Figure 5.16:
Figure 5.16:
New models for R&D in cancer drug discovery and development are needed.
Figure 6.1:
Figure 6.1:
Assessing therapeutic innovation in Italy

Similar articles

Cited by

References

    1. Jonsson B, Wilking N. Annals Oncol. 2007;18(3):iii1–54. doi: 10.1093/annonc/mdm095. - DOI - PubMed
    1. American Cancer Society Cancer Facts and Figures 2009.
    1. Kanavos P. The rising burden of cancer in the developing world. Annals Oncol. 2006;17(S8):viii16–23. - PubMed
    1. World Health Organisation . The Global Burden of Disease: 2004 update. WHO; 2008.
    1. Boyle P, Levin B, editors. World Cancer Report 2008. Lyon: International Agency for Research on Cancer; 2008.

LinkOut - more resources