. 2011:5:120-35.
doi: 10.2174/1874440001105010120. Epub 2011 Nov 4.

Absolute oxygenation metabolism measurements using magnetic resonance imaging

Affiliations

Absolute oxygenation metabolism measurements using magnetic resonance imaging

Hongyu An et al. Open Neuroimag J. 2011.

Abstract

Cerebral oxygen metabolism plays a critical role in maintaining normal function of the brain. It is the primary energy source to sustain neuronal functions. Abnormalities in oxygen metabolism occur in various neuro-pathologic conditions such as ischemic stroke, cerebral trauma, cancer, Alzheimer's disease and shock. Therefore, the ability to quantitatively measure tissue oxygenation and oxygen metabolism is essential to the understanding of pathophysiology and treatment of various diseases. The focus of this review is to provide an introduction of various blood oxygenation level dependent (BOLD) contrast methods for absolute measurements of tissue oxygenation, including both magnitude and phase image based approaches. The advantages and disadvantages of each method are discussed.

Keywords: Magnetic resonance imaging; blood oxygenation level dependent; cerebral metabolic rate of oxygen utilization; cerebral oxygen saturation; oxygen extraction fraction; oxygenation metabolism quantification; susceptibility weighted imaging..


Figures

Fig. (1)
Fig. (1)
Protocol overview for coronary sinus oximetry. A series of spin-echo images were acquired to estimate T2 in coronary sinus. Blood oxygenation was obtained using an in vitro calibration. For the example shown, sinus blood oxygenation was on the order of 65% (From Foltz et al, Magn Reson Med 1999, 42:837–848, with permission).
Fig. (2)
Fig. (2)
An overview of the T2-Relaxation-Under-Spin-Tagging (TRUST) method. a) magnetically labeled (Label, middle row) or unlabeled (Control, top row) images. Each pair of image is acquired at four different effective TE (eTE). The bottom row is the subtracted image, Control-Label. The red rectangle ROI indicates the region of interest containing sagittal sinus. b) T2 in the sagittal sinus was fitted using a monoexponential function. c) The T2 value is converted to venous oxygenation through a calibration curve. (From Lu and Ge, Magn Reson Med 2008, 60:357–363, with permission).
Fig. (3)
Fig. (3)
Representative spin echo anatomic image (a,e) R2΄ (b,f), vCBV (c,g), and OEF (d,h) maps under normocapnia (upper row) and hypercapnia (lower row), respectively. The color bars represent the absolute estimates of R2΄ (0-14 Hz), vCBV (0-14 %), and OEF (0-100%) (From An and Lin, Magn Reson Med 2003, 50:708–716, with permission).
Fig. (4)
Fig. (4)
MR measured oxygen saturation O2SatMR maps under control condition (a), moderate hypoxia (b), severe hypoxia (c) and hypercapnia (d). The color bar represents the scale for blood oxygenation (0 to 100%) (adapted from An et al. Stroke 2009, 40(6):2165-72, with permission).
Fig. (5)
Fig. (5)
(a) Correlation between the MR measured O2SatMRv vs. the blood gas O2Satsss in superior saggital sinus (closed symbols) during normal control (squares), hyperoxic hypercapnia (circles), moderate hypoxia (triangles) and severe hypoxia (diamonds). Linear regression O2SatMRv vs O2SatSSS (O2SatSSS = 0.9763 · O2SatMRν + 0.021, r=0.94, solid line) were plotted together with a line of identity (dotted line). (adapted from An et al. Stroke 2009, 40(6):2165-72, with permission).
Fig. (6)
Fig. (6)
Venous blood oxygen saturation maps obtained with the qBOLD technique from the rat under isoflurane (middle) and alphachloralose (right) anesthesia. The color bar shows the blood oxygenation level in %. The left image is the T1-weighted anatomic image. Mean values of venous blood oxygen saturation were 77% under isoflurane anesthesia and 62% under alpha-chloralose anesthesia (From He et al, Magn Reson Med. 2008 October ; 60(4): 882–888, with permission).
Fig. (7)
Fig. (7)
R2* maps before (left) and after (right) z shimming. Colorbar represents R2* range 0-50 Hz.
Fig. (8)
Fig. (8)
Background magnetic field (ΔB, left) was obtained using a high resolution 3D FLASH sequence. This background magnetic field nwas then utilized to correct signal loss. Before correction, vCBV was high in regions with large ΔB (middle) and it decreased after the correction (right). (Adapted from An and Lin, Magn Reson Med 2002, 47:958–966, with permission)
Fig. (9)
Fig. (9)
Monte Carlon simulation to demonstrate that diffusion effects depend on vessel size. A large deviation was observed between diffusion and static dephasing regime signal for vessels with a diameter of 7 µm, while negligible signal difference was detected for vessels with a diameter of 25 µm.
Fig. (10)
Fig. (10)
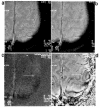
Examples of high-resolution 2D gradient echo images obtained during a motor cortex activation study (finger-tapping). Magnitude images obtained in the resting state (a) and activated state (b). The pial vein shows signal enhancement upon activation. (c) Difference image obtained by subtracting the resting state magnitude image from the magnitude image in the activation state. d: Phase image in the resting state. (From Haacke et al, Human Brain Mapping 1997, 5:341–346, with permission).
Fig. (11)
Fig. (11)
a Bar graph of jugular vein oxygen saturation measurements at rest and during breathholding. Oxygen saturation is significantly reduced during breath-holding (P <0.04, one-sided pairedsample t-test). b: Scatter plot of phase measurements comparing normal breathing and hypoventilation. The measured phase is significantly lower (P < 0.018) during hypoventilation, suggesting a reduction in oxygen saturation during this period. c: Time series of phase measurements (■) during alternate periods of normal breathing (1) and hypoventilation (o). (From Ferna´ndez-Seara et al, Magn Reson Med, 2006, 55:967–973, with permission).
Fig. (12)
Fig. (12)
Signal oscillation as a function of TE in an imaging voxel partially occupied by a vein and brain tissue. The volume fractions of the vein and brain tissue are λ and 1-λ, respectively. The arrows mark the corresponding phase evolution vs. TE. The extent to which signal may reduce (F(λ)) only depends on λ, while the period of the signal oscillation (G(oxy)) only depends on oxygen saturation.
Fig. (13)
Fig. (13)
Signal from a voxel containing both a single large vein and brain tissue is plotted as a function of TE for the pre (a) and post (b) contrast agent studies. Three representative veins were plotted (v1, v2 and v3). In addition, the theoretical prediction curve (solid line) was also plotted.
Fig. (14)
Fig. (14)
(a) A anatomic image to demonstrate the voxels with functional activation. (b) Logarithmic signal decay plotted versus echo time. Straight lines (triangles) correspond to resting state signal, dashed lines (squares) correspond to signal during stimulation. The lengthened oscillatory period during functional activation, suggesting an increase in blood oxygen saturation during fMRI. (Adapted from Barth et al, Magnetic Resonance Imaging, 1999, 17, No. 3, 321–329, with permission).

Similar articles

Cited by

References

    1. Grotta JC. Emerging stroke therapies. Semin Neurol. 1986;6(3 ):285–92. - PubMed
    1. Heiss WD, Graf R, Wienhard K, et al. Dynamic penumbra demonstrated by sequential multitracer PET after middle cerebral artery occlusion in cats. J Cereb Blood Flow Metab. 1994;14(6 ):892–902. - PubMed
    1. Baron JC, Rougemont D, Soussaline F, et al. Local interrelationships of cerebral oxygen consumption and glucose utilization in normal subjects and in ischemic stroke patients: a positron tomography study. J Cereb Blood Flow Metab. 1984;4(2 ):140–9. - PubMed
    1. Powers WJ, Grubb RL, Darriet D, Raichle ME. Cerebral blood flow and cerebral metabolic rate of oxygen requirements for cerebral function and viability in humans. J Cereb Blood Flow Metab. 1985;5(4 ):600–8. - PubMed
    1. Marchal G, Benali K, Iglesias S, Viader F, Derlon JM, Baron JC. Voxel-based mapping of irreversible ischaemic damage with PET in acute stroke. Brain. 1999;122 ( Pt 12 ):2387–400. - PubMed

LinkOut - more resources