. 2012;7(1):e29974.
doi: 10.1371/journal.pone.0029974. Epub 2012 Jan 20.

Analysis of marker-defined HNSCC subpopulations reveals a dynamic regulation of tumor initiating properties

Affiliations

Analysis of marker-defined HNSCC subpopulations reveals a dynamic regulation of tumor initiating properties

Paloma Bragado et al. PLoS One. 2012.

Abstract

Head and neck squamous carcinoma (HNSCC) tumors carry dismal long-term prognosis and the role of tumor initiating cells (TICs) in this cancer is unclear. We investigated in HNSCC xenografts whether specific tumor subpopulations contributed to tumor growth. We used a CFSE-based label retentions assay, CD49f (α6-integrin) surface levels and aldehyde dehydrogenase (ALDH) activity to profile HNSCC subpopulations. The tumorigenic potential of marker-positive and -negative subpopulations was tested in nude (Balb/c nu/nu) and NSG (NOD.Cg-Prkdc(scid) Il2rg(tm1Wjl)/SzJ) mice and chicken embryo chorioallantoic membrane (CAM) assays. Here we identified in HEp3, SQ20b and FaDu HNSCC xenografts a subpopulation of G0/G1-arrested slow-cycling CD49f(high)/ALDH1A1(high)/H3K4/K27me3(low) subpopulation (CD49f+) of tumor cells. A strikingly similar CD49f(high)/H3K27me3(low) subpopulation is also present in primary human HNSCC tumors and metastases. While only sorted CD49f(high)/ALDH(high), label retaining cells (LRC) proliferated immediately in vivo, with time the CD49f(low)/ALDH(low), non-LRC (NLRC) tumor cell subpopulations were also able to regain tumorigenic capacity; this was linked to restoration of CD49f(high)/ALDH(high), label retaining cells. In addition, CD49f is required for HEp3 cell tumorigenicity and to maintain low levels of H3K4/K27me3. CD49f+ cells also displayed reduced expression of the histone-lysine N-methyltransferase EZH2 and ERK1/2 phosphorylation. This suggests that although transiently quiescent, their unique chromatin structure is poised for rapid transcriptional activation. CD49f- cells can "reprogram" and also achieve this state eventually. We propose that in HNSCC tumors, epigenetic mechanisms likely driven by CD49f signaling dynamically regulate HNSCC xenograft phenotypic heterogeneity. This allows multiple tumor cell subpopulations to drive tumor growth suggesting that their dynamic nature renders them a "moving target" and their eradication might require more persistent strategies.


Conflict of interest statement

Competing Interests: The authors have declared that no competing interests exist.

Figures

Figure 1
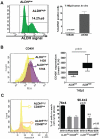
Figure 1. T-HEp3 Cells Contain an ALDH1A1high, CD49fhigh and CD44high Cell Sub-population.
(A) FACS analysis of ALDH1A1 activity in T-HEp3 tumors grown in nude mice. Left- Representative Histogram of ALDH1A1 expression. Percentages = frequency of ALDHhigh cells. Right- quantification of the percentage of ALDH1A1high cells in at least 3 different HEp3 tumors. (B) FACS analysis of CD49f expression in the ALDHhigh and ALDHlow subpopulations. Left - representative histograms, with numbers indicating the CD49f mean fluorescence intensity (MFI). Right - quantification of CD49f MFI in at least 3 different HEp3 tumors. (C) HEp3 tumor cells stained for ALDH1A1 activity, CD49f and Hoechst were FACS analyzed for cell cycle profile. Cell cycle profile (left) and quantification (right). Percentage of cells was calculated using BD FACSDiva software, excluding cell doublets and aggregates. Columns - mean of three independent experiments. The numbers represent the percentage of cells on G0-G1phase. p-values estimated using Mann-Whitney non-parametric test.
Figure 2
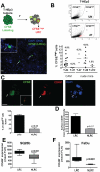
Figure 2. CD49fhigh Cells Are A Slow Cycling Population in T-HEp3 Tumors.
(A) Upper panel, strategy to use CFSE (20 µM) to identify LRCs in HEp3 tumors in vivo. CFSE diffuses into the cells and is esterified onto proteins. Cell division dilutes the label and the slow-cycling or growth arrested cells will retain the CFSE (label retaining cells - LRCs). Lower photograph - cytospin from a CFSE-labeled 4 day T-HEp3 tumor grown on the CAM. The LRCs (green cells, arrows) can be easily identified. Scale bar: 80 µm and 40 µm inset scale bar. (B) FACS detection and quantification of the CFSE population after in vivo growth. Upper panel - dot-plot graph of unstained (UN) T-HEp3 tumors; middle panel - CFSE labeled tumors after 7 days (d7) in vivo. Lower panel - percentage of LRCs determined by fluorescence microscopy in HEp3 (T) tumors grown on CAMs or nude mice d4–d12 after injection. Top numbers = mean percent of LRCs per tumor. (C) Detection of CD49f in LRCs and NLRCs in d6 CAM tumors by IF. LRCs (green) are positive for CD49f (red), arrows. Inset, merged image of CD49f and CFSE signals. CFSE signal bathes the whole cell but primarily the cytosol. CD49f signal in permeabilized HEp3 cells excluded completely the nucleus (Blue, DAPI). Scale bar: 60 µm and 40 µm inset scale bar. Lower panel graphs - quantification of CD49fhigh cells in both LRC and NLRC populations. (D) Quantification of surface CD49fhigh cells in both LRC and NLRC populations by FACS. p-values estimated using Mann-Whitney non-parametric test. (E–F) FACS quantification of CD49f expression in LRCs and NLRCs in SQ20b (E) and FaDu (F) tumors grown in nude mice. Statistical significance was estimated using Mann-Whitney non-parametric test and 95% confidence interval.
Figure 3
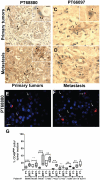
Figure 3. Primary tumors and metastasis from HNSCC patients contain a subpopulation of CD49fhigh cells.
(A–D) Representative CD49f staining in primary tumors (A and C) and lymph node metastasis (B and D) from two different patients. CD49fhigh tumor cells are marked with arrows. Note the strong cytosolic and membrane pattern of the signal (arrowhead in the, inset) and the overall stronger signal and increased frequency for CD49f in the metastatic lesions (B and D). Scale bar: 80 µm and 40 µm inset scale bar. (E–F) Immunofluorescence detection of CD49f in sections from human oral primary tumors (E) and metastasis (F) (PT68880). Scale bar: 60 µm. (G) Quantification of CD49fhigh cells in sections from primary tumors and lymph node metastasis. Columns represent mean of 5 different sections per sample and a minimum of 500 cells was scored per sample. p-values estimated using one-way ANOVA followed by the Bonferroni correction with two-tailed P values<0.05 considered significant.
Figure 4
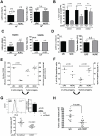
Figure 4. ALDHhigh, CD49fhigh, LRCs proliferative capacity in vivo.
(A) Sorting strategy for HEp3 cells with high or low levels of ALDH, CD49f, or both. (B) Sorting strategy for HEp3 tumors labeled with CFSE. (C–E) Quantification of tumor growth after 1 week in vivo on CAM. Dots represent the number of tumor cells per nodule. CD49fhigh vs. CD49flow cells (C), LRC vs. NLRCs (D), and (E) ALDHhigh/CD49fhigh vs. ALDHlow/CD49flow. (F) Quantification of tumor growth after 24 h in vivo on CAM. Dots represent the number of tumor cells per nodule. (G) Representative images of tumor nodules produced by ALDHhigh/CD49fhigh and ALDHlow/CD49flow (left panel) or LRCs and NLRCs (right panel). T = tumor, H = host tissue (CAM), I = inoculation site. Scale bar: 8 mm. p-values estimated using one-way ANOVA followed by the Bonferroni correction with two-tailed P values<0.05 considered significant.
Figure 5
Figure 5. CD49flow/NLRCs can regain their tumorigenic capacity and restore CD49f and ALDH1A1 expression.
(A) Tumor latency (left panel) and tumor take (Right panel) of HEp3 LRCs and NLRCs that were injected in nude mice (103 cells/mice). Graphs show mean ± SD. The numbers represent the number of animals per group. (B) Quantification of tumor growth by CD49fhighand CD49flow HEp3 cells upon serial transplantation on CAMs (1–3 weeks). (C) Tumor latency (left panel) and tumor take (Right panel) of SQ20b LRCs and NLRCs that were injected in NSG mice with matrigel (103 cells/mice). Graphs show mean ± SD. The numbers represent the number of animals per group. (D) Tumor latency (left) and tumor take (right) of the progeny of HEp3 LRCs and NLRCs after expansion in culture and injection in nude mice. (E–F) FACS analysis of surface CD49f (E) and ALDH1A1 (F) expression in the in vitro expanded progeny of LRCs and NLRCs (in vitro progeny) (Left part of the graph) and in tumors from the progeny of the LRCs and NLRCs expanded in culture (Tumor progeny)( Right part of the graph). (G) Quantification of HEp3 tumor growth after inhibition of CD49f using siRNA (Lower graph). Inhibition of CD49f expression was measured by FACs (upper left panel) and qPCR (upper right panel) (siC = SiRNA scrambled; siCD49f = siRNA CD49f). (H) Quantification of HEp3 tumor growth after treatment with a CD49f blocking antibody or an isotype matched IgG. p-values estimated using Mann-Whitney non-parametric test.
Figure 6
Figure 6. Characterization of ERK signaling and H3 post-translational modifications in TICs.
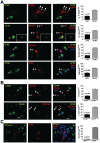
(A) Detection of K27me3, K4me3, EZH2 and P-ERK1/2 by IF in CFSE-labeled HEp3 cells grown in vivo for 4 days. Representative images, LRCs stained for P-ERK (confocal scanning image – scale bar = 60 µm), K27me3, K4me3 and EZH2 (all standard fluorescence microscopy images – scale bar = 80 µm- scale bar inset = 60 µm). Contour of LRCs is delineated with a dashed green line. Arrows = LRCs, arrows with circle = NLRCs. Quantification of marker-positive or negative in LRCS and NLRCs is shown in the graphs on the right. Y axes show the percentage of cells per tumor. Graphs show mean ± SD of three independent tumors. (B) Detection of CD49f, K27me3 and K4me3 in HEp3 cells grown in vivo 6 days. Representative images of CD49f, K27me3 and K4me3, standard fluorescence microscopy images – scale bar = 80 µm- Contour of CD49fhigh cells is delineated with a dashed green line. Arrows = CD49fhigh, arrows with circle = CD49flow. Quantification of marker-positive or negative in CD49fhigh and CD49flow cells is shown on the graphs on the right. Y axes show the percentage of cells per tumor. Graphs show mean ± SD of three independent tumors. (C) Detection of K27me3 and CD49f in sections from human oral primary tumors (PT68880). Scale bar = 80 µm. CD49f positive cells are delineated with a dashed red line. Y axes show the percentage of cells per section. p-values estimated using Mann-Whitney non-parametric test.
Figure 7
Figure 7. Characterization of H3 post-translational modifications upon knockdown of CD49f.
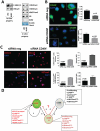
(A) Immunoblot of phospho- and total-ERK1/2, H3K27me3, H3K4me3, H3K9me3 and EZH2 expression in LRCs and NLRCs sorted and expanded in vitro. Total ERK1/2 and Amido black were used as loading controls. (B) Inhibition of CD49f in HEp3 cells grown in vivo 6 days. Left panels: representative images of CD49f in HEp3 cells transfected with a scrambled siRNA (siRNA neg) or with a siRNA CD49f. The cells were permeabilized, thus CD49f signal bathes the whole cell but primarily the cytosol (scale bar = 60 µm). Insets, overlay of CD49f and DAPI, showing the CD49f characteristic membrane and cytosolic staining (Scale bar = 40 µM). Upper right graph- quantification of CD49f mean fluorescence intensity (MFI). Lower right graph,-quantification of CD49f expression by qPCR. (C). Representative images of K4me3 and K27me3 in HEp3 cells transfected with a scrambled siRNA (siRNA neg) or with a siRNA CD49f. Left panels- standard fluorescence microscopy images – scale bar = 80 µm. Quantification of K27me3high and K4me3high percentage of cells and mean fluorescence intensity is shown on the graphs on the right. Graphs show mean ± SD of three independent tumors. p-values estimated using Mann-Whitney non-parametric test. (D) Scheme depicting the hypothetical behavior of different populations in HNSCC tumors. Marker high (CD49f+) and marker low (CD49f) populations within HNSCC tumors can be defined by their corresponding programs characterized by the markers indicated in the dialogue boxes. CD49f+ can self-renew (path 1) or after transiting through an intermediary state (CD49f+/−) (Path 2) fully reprogram into CD49f (Path2+3). The intermediary state (CD49f+/−) is defined by default by the markers in the dialogue box. The MTP model proposed that CD49f cells can also transit through the intermediary state (Path 4) to then fully reprogram into CD49f+ (Paths 4+5). Our model also considers that the different paths are stochastic and tumor cells might transition back and forth between the different states. A remaining open question is what controls the dynamic plasticity that drives the alternation between these states (question mark).

Similar articles

Cited by

References

    1. Myers EN. Head and neck oncology–2010, part II. Otolaryngol Pol. 2010;64:204–214. - PubMed
    1. Myers EN. Head and neck oncology–2010, Part I. Otolaryngol Pol. 2010;64:136–146. - PubMed
    1. Prince ME, Sivanandan R, Kaczorowski A, Wolf GT, Kaplan MJ, et al. Identification of a subpopulation of cells with cancer stem cell properties in head and neck squamous cell carcinoma. Proc Natl Acad Sci U S A. 2007;104:973–978. - PMC - PubMed
    1. Lukacs RU, Memarzadeh S, Wu H, Witte ON. Bmi-1 is a crucial regulator of prostate stem cell self-renewal and malignant transformation. Cell Stem Cell. 2010;7:682–693. - PMC - PubMed
    1. Clay MR, Tabor M, Owen JH, Carey TE, Bradford CR, et al. Single-marker identification of head and neck squamous cell carcinoma cancer stem cells with aldehyde dehydrogenase. Head Neck. 2010;32:1195–1201. - PMC - PubMed

Publication types