. 2012;7(1):e29979.
doi: 10.1371/journal.pone.0029979. Epub 2012 Jan 20.

Expression profiling of human immune cell subsets identifies miRNA-mRNA regulatory relationships correlated with cell type specific expression

Affiliations

Expression profiling of human immune cell subsets identifies miRNA-mRNA regulatory relationships correlated with cell type specific expression

Florence Allantaz et al. PLoS One. 2012.

Abstract

Blood consists of different cell populations with distinct functions and correspondingly, distinct gene expression profiles. In this study, global miRNA expression profiling was performed across a panel of nine human immune cell subsets (neutrophils, eosinophils, monocytes, B cells, NK cells, CD4 T cells, CD8 T cells, mDCs and pDCs) to identify cell-type specific miRNAs. mRNA expression profiling was performed on the same samples to determine if miRNAs specific to certain cell types down-regulated expression levels of their target genes. Six cell-type specific miRNAs (miR-143; neutrophil specific, miR-125; T cells and neutrophil specific, miR-500; monocyte and pDC specific, miR-150; lymphoid cell specific, miR-652 and miR-223; both myeloid cell specific) were negatively correlated with expression of their predicted target genes. These results were further validated using an independent cohort where similar immune cell subsets were isolated and profiled for both miRNA and mRNA expression. miRNAs which negatively correlated with target gene expression in both cohorts were identified as candidates for miRNA/mRNA regulatory pairs and were used to construct a cell-type specific regulatory network. miRNA/mRNA pairs formed two distinct clusters in the network corresponding to myeloid (nine miRNAs) and lymphoid lineages (two miRNAs). Several myeloid specific miRNAs targeted common genes including ABL2, EIF4A2, EPC1 and INO80D; these common targets were enriched for genes involved in the regulation of gene expression (p<9.0E-7). Those miRNA might therefore have significant further effect on gene expression by repressing the expression of genes involved in transcriptional regulation. The miRNA and mRNA expression profiles reported in this study form a comprehensive transcriptome database of various human blood cells and serve as a valuable resource for elucidating the role of miRNA mediated regulation in the establishment of immune cell identity.


Conflict of interest statement

Competing Interests: The authors have read the journal's policy and have the following conflicts. FA, DC, TB, PR, ME, LB, BR, HB, SS, GDP, MEB, and, JV are employees of Hoffmann-LaRoche. This does not alter the authors′ adherence to all the PLoS ONE policies on sharing data and materials.

Figures

Figure 1
Figure 1. Cell type specific expression of miRNAs.
miRNAs were grouped based on specificity to one, two or three cell types. A) miR-143 and miR-31 were specific to neutrophils and T cells respectively, while B) miR-362 and miR-125 were specific to monocytes, pDCs and T cells, neutrophils. C) miR-223 was specific to myeloid lineage cells (neutrophils, eosinophils and monocytes), whereas miR-155 was specific to lymphoid lineage cells (pDCs, T cells, B cells and NK cells).
Figure 2
Figure 2. 542 mRNA transcripts are uniquely up or down-regulated in one cell type.
696 genes were specifically up or down-regulated in one, two or three different cell-types, with the majority of genes (542) uniquely up or down-regulated in a single cell-type. Transformed expression levels are indicated by color scale, with red representing relative high expression and green relative low expression.
Figure 3
Figure 3. Potential miR-223 targets are repressed in a miR-223 −/− system.
A) miR-223 expression across the profiled cell types (bars) is plotted against the relative expression profile (lines) of 82 genes identified as potential miR-223 targets (TargetScan, significant negative correlation). Red line represent mean expression profile of target genes, dotted line represents mean expression across cell types. B) 82 genes were identified in our study as being significant miR-223 targets. We used the data from a previously published miR-223 −/− system to see if those targets would correspondingly be de-repressed when miR-223 is knocked-out. 62 of these 82 genes had matching mouse homologs (in red). The change in expression of these genes was compared against all TargetScan predicted miRNA target genes, which included predicted targets not negatively correlated with miRNA expression in our dataset (234 genes, in blue). Fold-change for all probe sets is also plotted in this figure as a null distribution (black).
Figure 4
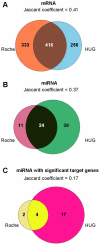
Figure 4. Significant overlap observed between Roche and HUG datasets.
A) Excluding mDCs and pDCs, 749 genes were identified as cell-type specific in the Roche dataset, compared to 672 in HUG dataset. 416 genes were common to both (p<2.2e-16). The Jaccard coefficient (i.e. the intersection to union ratio), which measures sample set similarity, is 0.41. B) Excluding mDCs and pDCs, 35 miRNAs were identified as cell-type specific in the Roche dataset, compared to 54 in HUG dataset. 24 miRNAs were common to both (p<2.2e-16) with a Jaccard coefficient of 0.37. C) 6 miRNAs were significantly negatively correlated with their TargetScan predicted target genes in the Roche dataset, compared to 21 in the HUG dataset. 4 miRNAs were common to both datasets with a Jaccard coefficient of 0.17.
Figure 5
Figure 5. Regulatory network identifying genes that are shared targets of cell-type specific miRNAs.
Networks depicting regulatory interactions between miRNAs and their respective target genes. miRNAs are coloured red, whereas target genes are coloured yellow. An edge from a miRNA node to a mRNA node indicates that the gene is both predicted to be a miRNA target by TargetScan and significantly negatively correlated with miRNA expression across the profiled blood cell subsets.

References

    1. Wang M, Windgassen D, Papoutsakis ET. Comparative analysis of transcriptional profiling of CD3+, CD4+ and CD8+ T cells identifies novel immune response players in T-cell activation. BMC Genomics. 2008;9:225. - PMC - PubMed
    1. Lindstedt M, Lundberg K, Borrebaeck CA. Gene family clustering identifies functionally associated subsets of human in vivo blood and tonsillar dendritic cells. J Immunol. 2005;175:4839–4846. - PubMed
    1. Zhao C, Zhang H, Wong WC, Sem X, Han H, et al. Identification of novel functional differences in monocyte subsets using proteomic and transcriptomic methods. J Proteome Res. 2009;8:4028–4038. - PubMed
    1. Ehrhardt GR, Hijikata A, Kitamura H, Ohara O, Wang JY, et al. Discriminating gene expression profiles of memory B cell subpopulations. J Exp Med. 2008;205:1807–1817. - PMC - PubMed
    1. Macaulay IC, Tijssen MR, Thijssen-Timmer DC, Gusnanto A, Steward M, et al. Comparative gene expression profiling of in vitro differentiated megakaryocytes and erythroblasts identifies novel activatory and inhibitory platelet membrane proteins. Blood. 2007;109:3260–3269. - PMC - PubMed

Publication types