. 2012;7(1):e29981.
doi: 10.1371/journal.pone.0029981. Epub 2012 Jan 19.

Evidence of the cost of the production of microcystins by Microcystis aeruginosa under differing light and nitrate environmental conditions

Affiliations

Evidence of the cost of the production of microcystins by Microcystis aeruginosa under differing light and nitrate environmental conditions

Enora Briand et al. PLoS One. 2012.

Erratum in

  • PLoS One. 2012;7(3). doi: 10.1371/annotation/e987f670-24bf-495c-87c4-6ba8c786ddae

Abstract

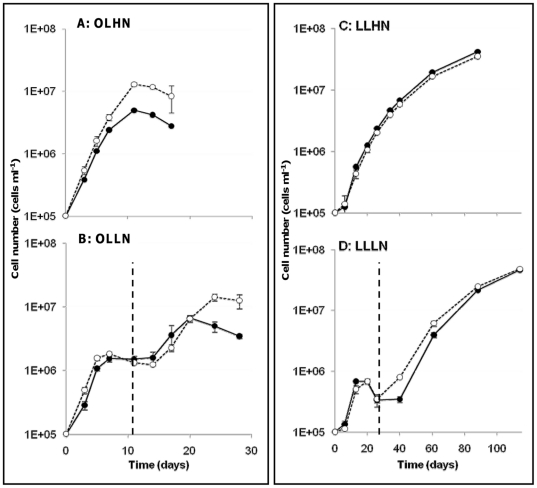
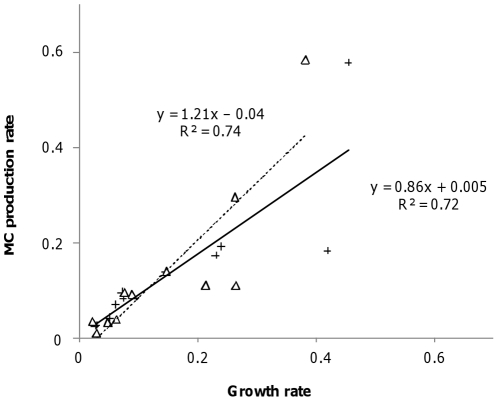
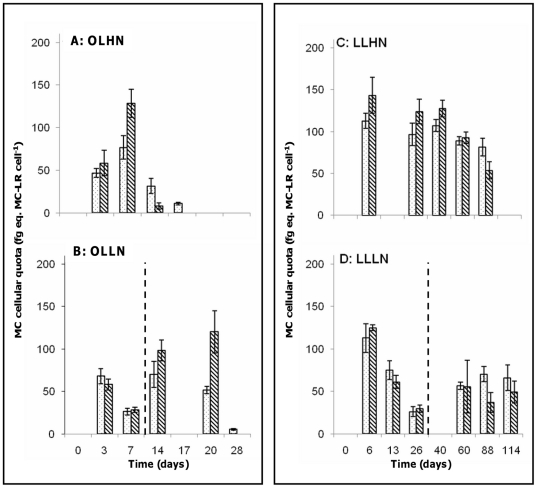
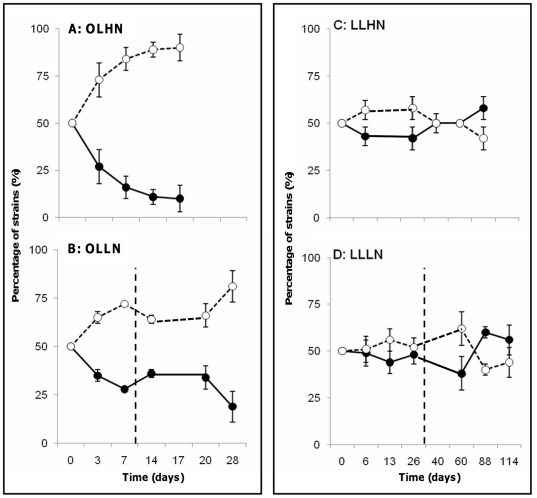
The cyanobacterium Microcystis aeruginosa is known to proliferate in freshwater ecosystems and to produce microcystins. It is now well established that much of the variability of bloom toxicity is due to differences in the relative proportions of microcystin-producing and non-microcystin-producing cells in cyanobacterial populations. In an attempt to elucidate changes in their relative proportions during cyanobacterial blooms, we compared the fitness of the microcystin-producing M. aeruginosa PCC 7806 strain (WT) to that of its non-microcystin-producing mutant (MT). We investigated the effects of two light intensities and of limiting and non-limiting nitrate concentrations on the growth of these strains in monoculture and co-culture experiments. We also monitored various physiological parameters, and microcystin production by the WT strain. In monoculture experiments, no significant difference was found between the growth rates or physiological characteristics of the two strains during the exponential growth phase. In contrast, the MT strain was found to dominate the WT strain in co-culture experiments under favorable growth conditions. Moreover, we also found an increase in the growth rate of the MT strain and in the cellular MC content of the WT strain. Our findings suggest that differences in the fitness of these two strains under optimum growth conditions were attributable to the cost to microcystin-producing cells of producing microcystins, and to the putative existence of cooperation processes involving direct interactions between these strains.


Conflict of interest statement

Competing Interests: This research was partly funded by Electricité de France Research&Development (EDF R&D). Marie-José Salençon is employed by Electricité de France Research&Development (EDF R&D). There are no patents, products in development or marketed products to declare. This does not alter the authors′ adherence to all the PLoS ONE policies on sharing data and materials, as detailed online in the guide for authors. All other authors have declared that no competing interests exist.

Figures

Figure 1
Figure 1. Growth curves of the WT (black circles) and MT (white circles) strains in monoculture experiments under different environmental conditions.
A OLHN (optimal light and high nitrogen concentrations), B OLLN (optimal light and low nitrogen concentrations), C LLHN (low light and high nitrogen concentrations), and D LLLN (low light and low nitrogen concentrations). Error bars represent the standard deviation (N = 3). NO3 was added (dashed line) on day 11 under OLLN conditions, and on day 26 under LLLN conditions.
Figure 2
Figure 2. Relationship between cell growth rates and MC production rates of the WT strain.
Each point represents the mean value of triplicate determinations. Rates were calculated between successive sampling points during the exponential growth phase in monoculture experiments (crosses and continuous line), and in co-culture experiments (triangles and dashed line).
Figure 3
Figure 3. Time-course of the intracellular MC content in monoculture (histograms with black points) and in co-culture (hatched histograms) experiments under different culture conditions.
A OLHN (optimal light and high nitrogen), B OLLN (optimal light and low nitrogen), C LLHN (low light and high nitrogen), and D LLLN (low light and low nitrogen). Error bars represent the standard deviation (N = 3). NO3 was added (dashed line) on day 11 under OLLN conditions, and on day 26 under LLLN conditions.
Figure 4
Figure 4. Time-course of the relative proportions of the WT (black circles) and MT (white circles) strains in co-culture experiments under different culture conditions.
A OLHN (optimal light and high nitrogen), B OLLN (optimal light and low nitrogen), C LLHN (low light and high nitrogen), and D LLLN (low light and low nitrogen). Error bars represent the standard deviation (N = 3). NO3 was added (dashed line) on day 11 under OLLN conditions, and on day 26 under LLLN conditions.

References

    1. Briand JF, Jacquet S, Bernard C, Humbert JF. Health hazards for terrestrial vertebrates from toxic cyanobacteria in surface water ecosystems. Vet Res. 2003;34:361–378. - PubMed
    1. Kuiper-Goodman T, Falconer I, Fitzgerald J. Chorus I, Bartram F, editors. Human health aspects. Toxic cyanobacteria in water. 1999. pp. 41–111. E & FN Spon, London and New-York.
    1. Kardinaal WEA, Visser PM. Huisman J, Matthijs HCP, Visser PM, editors. Dynamics of cyanobacterial toxins. Harmful Cyanobacteria Aquatic Ecology Series. 2005. pp. 41–64. Springer, Dordrecht, the Netherlands.
    1. Sabart M, Pobel D, Briand E, Combourieu B, Salençon MJ, et al. Spatiotemporal variations in microcystin concentrations and in the proportions of microcystin-producing cells in several Microcystis aeruginosa populations. Appl Environ Microbiol. 2010;76:4750–4759. - PMC - PubMed
    1. Kurmayer R, Kutzenberger T. Application of real-time PCR for quantification of microcystin genotypes in a population of the toxic cyanobacterium Microcystis sp. Appl Environ Microbiol. 2003;69:6723–6730. - PMC - PubMed

Publication types