

Prognostic significance and gene expression profiles of p53 mutations in microsatellite-stable stage III colorectal adenocarcinomas
- PMID: 22276141
- PMCID: PMC3261849
- DOI: 10.1371/journal.pone.0030020
Prognostic significance and gene expression profiles of p53 mutations in microsatellite-stable stage III colorectal adenocarcinomas
Abstract
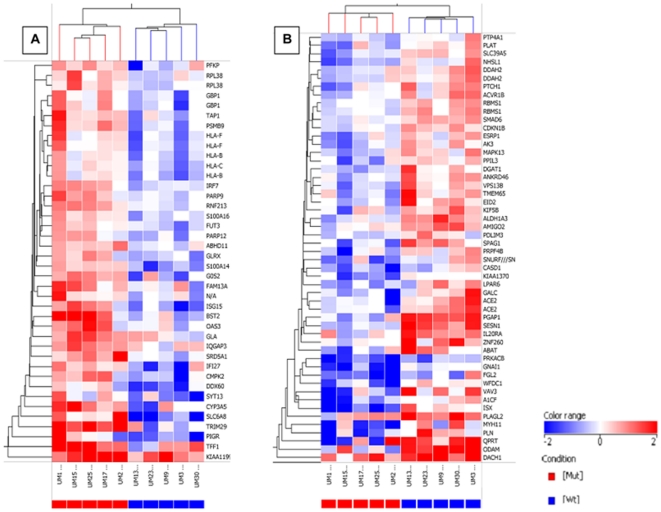
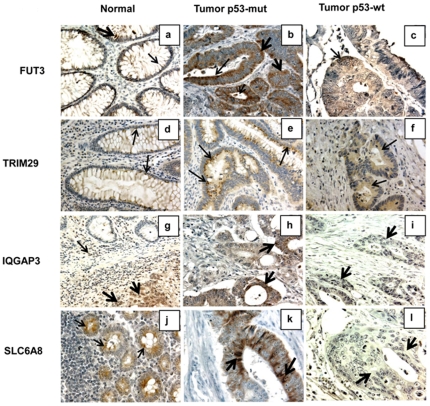
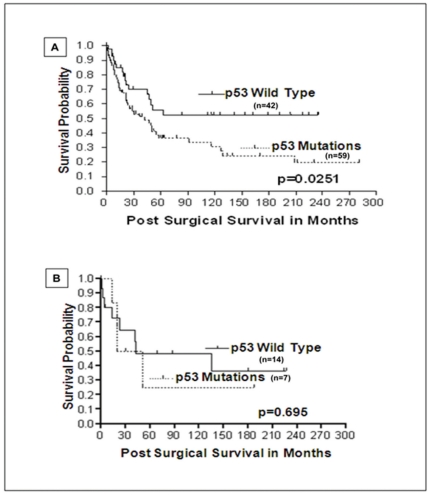
Although the prognostic value of p53 abnormalities in Stage III microsatellite stable (MSS) colorectal cancers (CRCs) is known, the gene expression profiles specific to the p53 status in the MSS background are not known. Therefore, the current investigation has focused on identification and validation of the gene expression profiles associated with p53 mutant phenotypes in MSS Stage III CRCs. Genomic DNA extracted from 135 formalin-fixed paraffin-embedded tissues, was analyzed for microsatellite instability (MSI) and p53 mutations. Further, mRNA samples extracted from five p53-mutant and five p53-wild-type MSS-CRC snap-frozen tissues were profiled for differential gene expression by Affymetrix Human Genome U133 Plus 2.0 arrays. Differentially expressed genes were further validated by the high-throughput quantitative nuclease protection assay (qNPA), and confirmed by quantitative real-time polymerase chain reaction (qRT-PCR) and by immunohistochemistry (IHC). Survival rates were estimated by Kaplan-Meier and Cox regression analyses. A higher incidence of p53 mutations was found in MSS (58%) than in MSI (30%) phenotypes. Both univariate (log-rank, P = 0.025) and multivariate (hazard ratio, 2.52; 95% confidence interval, 1.25-5.08) analyses have demonstrated that patients with MSS-p53 mutant phenotypes had poor CRC-specific survival when compared to MSS-p53 wild-type phenotypes. Gene expression analyses identified 84 differentially expressed genes. Of 49 down-regulated genes, LPAR6, PDLIM3, and PLAT, and, of 35 up-regulated genes, TRIM29, FUT3, IQGAP3, and SLC6A8 were confirmed by qNPA, qRT-PCR, and IHC platforms. p53 mutations are associated with poor survival of patients with Stage III MSS CRCs and p53-mutant and wild-type phenotypes have distinct gene expression profiles that might be helpful in identifying aggressive subsets.
Conflict of interest statement
Figures

Similar articles
-
Relationship between genetic alterations and prognosis in sporadic colorectal cancer.Int J Cancer. 2006 Apr 1;118(7):1721-7. doi: 10.1002/ijc.21563. Int J Cancer. 2006. PMID: 16231316
-
Sporadic colorectal adenocarcinomas with high-frequency microsatellite instability.Cancer. 2000 Nov 15;89(10):2025-37. Cancer. 2000. PMID: 11066042
-
Mutations in the WTX-gene are found in some high-grade microsatellite instable (MSI-H) colorectal cancers.BMC Cancer. 2010 Aug 9;10:413. doi: 10.1186/1471-2407-10-413. BMC Cancer. 2010. PMID: 20696052 Free PMC article.
-
p53 mutation is common in microsatellite stable, BRAF mutant colorectal cancers.Int J Cancer. 2012 Apr 1;130(7):1567-76. doi: 10.1002/ijc.26175. Epub 2011 Aug 3. Int J Cancer. 2012. PMID: 21557216
-
The Association Between Mutations in BRAF and Colorectal Cancer-Specific Survival Depends on Microsatellite Status and Tumor Stage.Clin Gastroenterol Hepatol. 2019 Feb;17(3):455-462.e6. doi: 10.1016/j.cgh.2018.04.015. Epub 2018 Apr 13. Clin Gastroenterol Hepatol. 2019. PMID: 29660527
Cited by
-
Lysophosphatidic Acid Receptor 6 (LPAR6) Expression and Prospective Signaling Pathway Analysis in Breast Cancer.Mol Diagn Ther. 2019 Feb;23(1):127-138. doi: 10.1007/s40291-019-00384-3. Mol Diagn Ther. 2019. PMID: 30694446
-
Rac1 Signaling: From Intestinal Homeostasis to Colorectal Cancer Metastasis.Cancers (Basel). 2020 Mar 12;12(3):665. doi: 10.3390/cancers12030665. Cancers (Basel). 2020. PMID: 32178475 Free PMC article. Review.
-
SLC6A8 is involved in the progression of non-small cell lung cancer through the Notch signaling pathway.Ann Transl Med. 2021 Feb;9(3):264. doi: 10.21037/atm-20-5984. Ann Transl Med. 2021. PMID: 33708891 Free PMC article.
-
Patterns of Somatic Variants in Colorectal Adenoma and Carcinoma Tissue and Matched Plasma Samples from the Hungarian Oncogenome Program.Cancers (Basel). 2023 Jan 31;15(3):907. doi: 10.3390/cancers15030907. Cancers (Basel). 2023. PMID: 36765865 Free PMC article.
-
A Panel of Genes Identified as Targets for 8q24.13-24.3 Gain Contributing to Unfavorable Overall Survival in Patients with Hepatocellular Carcinoma.Curr Med Sci. 2018 Aug;38(4):590-596. doi: 10.1007/s11596-018-1918-x. Epub 2018 Aug 20. Curr Med Sci. 2018. PMID: 30128866
References
-
- Welter S, Jacobs J, Krbek T, Poettgen C, Stamatis G. Prognostic impact of lymph node involvement in pulmonary metastases from colorectal cancer. Eur J Cardiothorac Surg. 2007;31:167–172. - PubMed
-
- Yamashita H, Noguchi S, Murakami N, Kawamoto H, Watanabe S. Extracapsular invasion of lymph node metastasis is an indicator of distant metastasis and poor prognosis in patients with thyroid papillary carcinoma. Cancer. 1997;80:2268–2272. - PubMed
-
- Vogelstein B, Fearon ER, Hamilton SR, Kern SE, Preisinger AC, et al. Genetic alterations during colorectal-tumor development. N Engl J Med. 1988;319:525–532. - PubMed
-
- Popat S, Houlston RS. A systematic review and meta-analysis of the relationship between chromosome 18q genotype, DCC status and colorectal cancer prognosis. Eur J Cancer. 2005;41:2060–2070. - PubMed
-
- Jass JR, Young J, Leggett BA. Evolution of colorectal cancer: change of pace and change of direction. J Gastroenterol Hepatol. 2002;17:17–26. - PubMed
Publication types
MeSH terms
Substances
Grants and funding
LinkOut - more resources
Full Text Sources
Medical
Molecular Biology Databases
Research Materials
Miscellaneous
