. 2012;7(1):e30255.
doi: 10.1371/journal.pone.0030255. Epub 2012 Jan 19.

Decreased autocrine EGFR signaling in metastatic breast cancer cells inhibits tumor growth in bone and mammary fat pad

Affiliations

Decreased autocrine EGFR signaling in metastatic breast cancer cells inhibits tumor growth in bone and mammary fat pad

Nicole K Nickerson et al. PLoS One. 2012.

Abstract

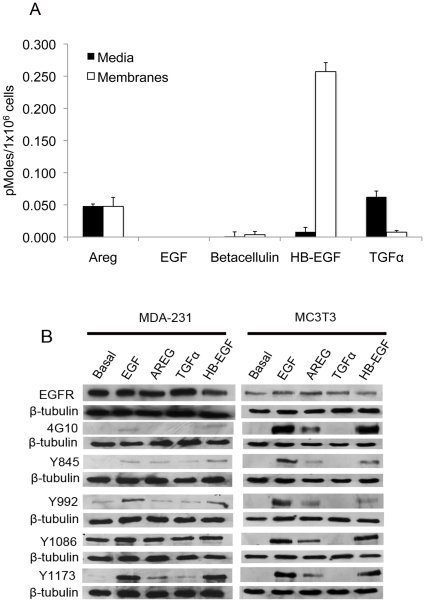
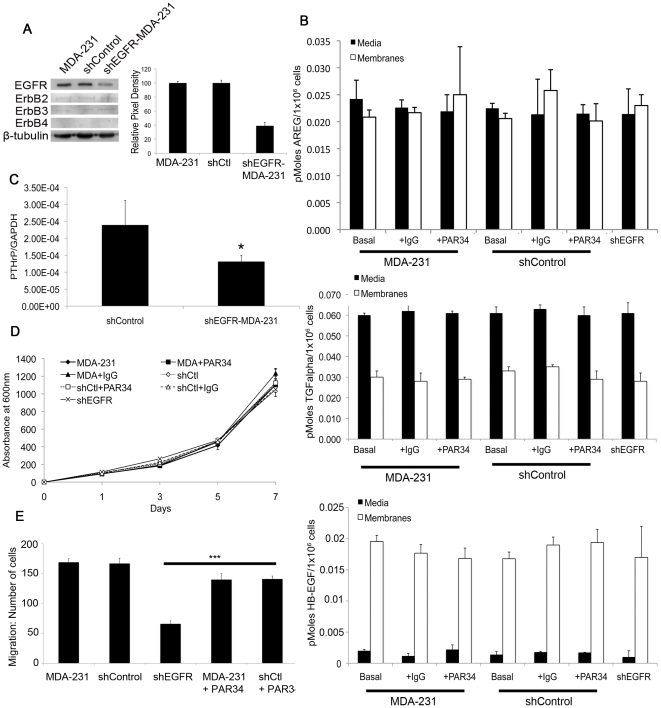
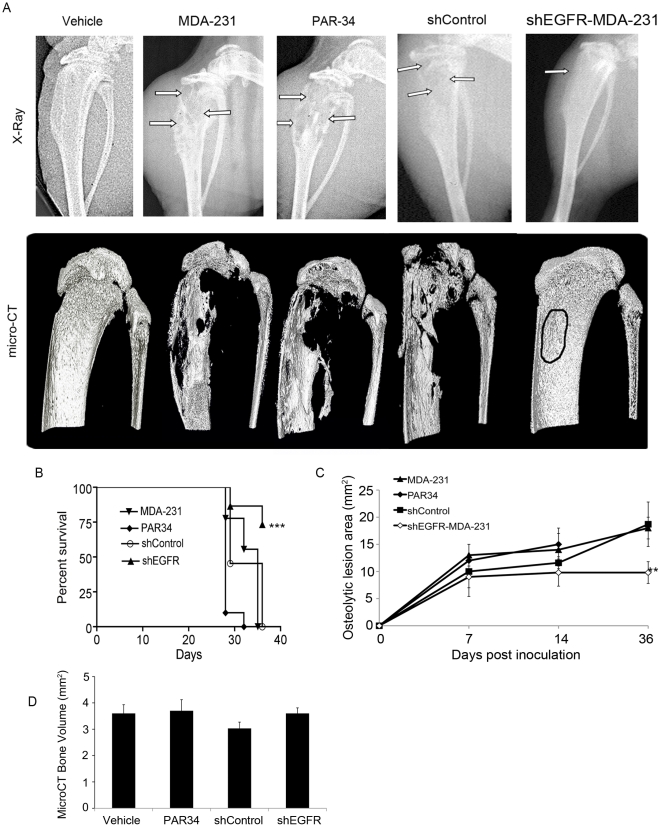
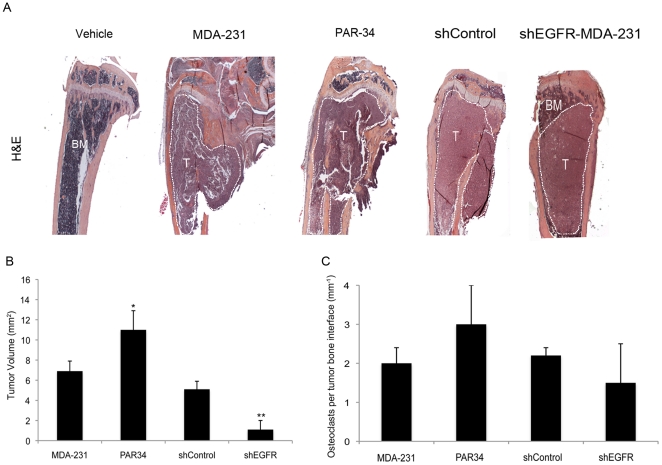
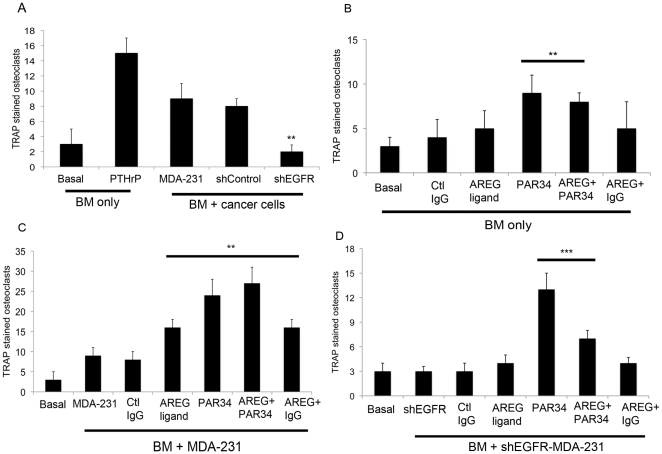
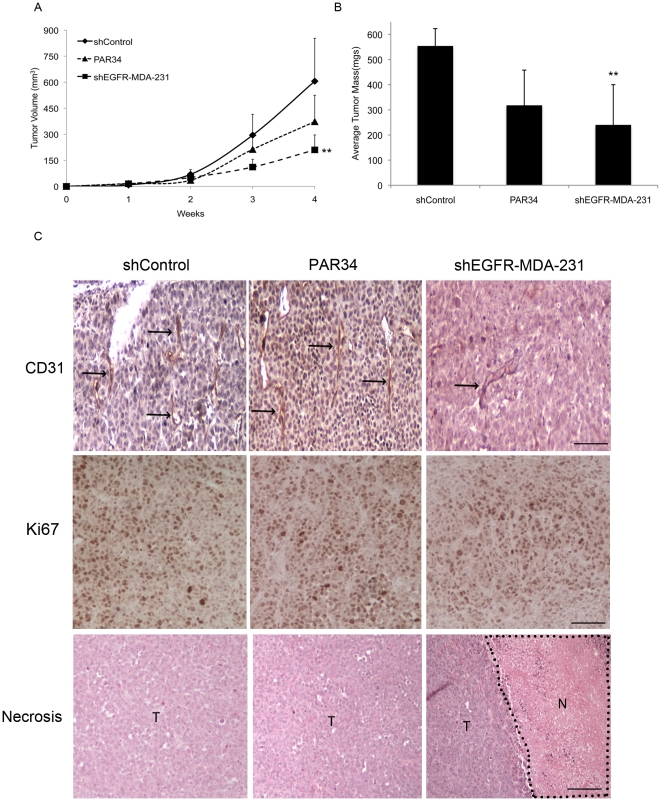
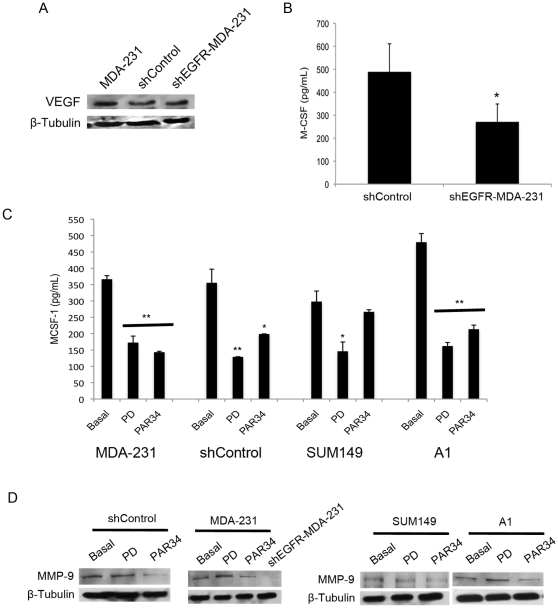
Breast cancer metastasis to bone triggers a vicious cycle of tumor growth linked to osteolysis. Breast cancer cells and osteoblasts express the epidermal growth factor receptor (EGFR) and produce ErbB family ligands, suggesting participation of these growth factors in autocrine and paracrine signaling within the bone microenvironment. EGFR ligand expression was profiled in the bone metastatic MDA-MB-231 cells (MDA-231), and agonist-induced signaling was examined in both breast cancer and osteoblast-like cells. Both paracrine and autocrine EGFR signaling were inhibited with a neutralizing amphiregulin antibody, PAR34, whereas shRNA to the EGFR was used to specifically block autocrine signaling in MDA-231 cells. The impact of these was evaluated with proliferation, migration and gene expression assays. Breast cancer metastasis to bone was modeled in female athymic nude mice with intratibial inoculation of MDA-231 cells, and cancer cell-bone marrow co-cultures. EGFR knockdown, but not PAR34 treatment, decreased osteoclasts formed in vitro (p<0.01), reduced osteolytic lesion tumor volume (p<0.01), increased survivorship in vivo (p<0.001), and resulted in decreased MDA-231 growth in the fat pad (p<0.01). Fat pad shEGFR-MDA-231 tumors produced in nude mice had increased necrotic areas and decreased CD31-positive vasculature. shEGFR-MDA-231 cells also produced decreased levels of the proangiogenic molecules macrophage colony stimulating factor-1 (MCSF-1) and matrix metalloproteinase 9 (MMP9), both of which were decreased by EGFR inhibitors in a panel of EGFR-positive breast cancer cells. Thus, inhibiting autocrine EGFR signaling in breast cancer cells may provide a means for reducing paracrine factor production that facilitates microenvironment support in the bone and mammary gland.


Conflict of interest statement

Competing Interests: The authors have declared that no competing interests exist.

Figures

Figure 1
Figure 1. EGFR ligand expression and shedding in MDA-231 cells.
(A) ELISA measurement of media or membrane extracts from MDA-231 cells. Measurements were taken from two independent cultures and performed in triplicate. (B) Western blots of anti-EGFR and anti-phosphorylated tyrosine resides in MDA-231 or MC3T3 cells treated with EGF, AREG, TGFα, or HB-EGF.
Figure 2
Figure 2. Characterization of the shEGFR-MDA-231 cell line.
(A) Extracts from MDA-231, shControl, and shEGFR-MDA-231 cells, probed with anti-EGFR or anti-ErbB2, ErbB3, or ErbB4 antibodies and anti-β-Tubulin (loading control). Histogram notes relative pixel density of EGFR protein of shEGFR-MDA-231 cells versus shControl and MDA-231 cells. (B) AREG, TGFα, and HB-EGF ELISA measurements of MDA-231, shControl, and shEGFR-MDA-231 cells, to verify no changes in basal or PAR34 treated ligand expression. ELISA measurements were performed in triplicate from two separate cultures. (C) Relative PTHrP mRNA levels in the shControl and shEGFR-MDA-231 cell lines. PTHrP was measured by qRT-PCR analysis and relative ratios of PTHrP mRNA to GAPDH mRNA levels were shown (mean of triplicate measures from a single experiment; bars, SD). (D) MTT proliferation assays were performed on shEGFR-MDA-231, MDA-231, and shControl cells, as well as PAR34-treated MDA-231 or shControl cells. MTT measurements were performed in quadruplicate, p<0.05. (E) 24 hour migration assay of shEGFR-MDA-231, MDA-231, and shControl cells, with PAR34 treatment to the latter two lines, p<0.001. Migrated cells were obtained from two separate migration wells, with four random fields chosen for counts from each well.
Figure 3
Figure 3. In vivo analysis of autocrine or paracrine inhibition of EGFR.
(A) Representative end point x-rays for each treatment group (top row), with arrows denoting osteolytic lesion areas. Corresponding 3D micro-CT images (bottom row). n = 10 animals per treatment group. (B) Kaplan-meyer survival curve demonstrating significant increased survival in the shEGFR-MDA-231 injected animals, p<0.001. n = 10 animals per group. (C) Osteolytic lesion area was measured using ImageJ software from x-ray images. n = 10 mice, p<0.01. PAR34-treated animals required sacrifice at the 3-week time point due to maximum allowable lesion areas and pain scale (per our animal protocol). (D) Micro-CT bone volume analysis of tibiae in all treatment groups. 700 sections were analyzed per tibia. p = not significant.
Figure 4
Figure 4. Histomorphometric analysis of tumor bearing bones.
(A) Representative images of H&E stained tibiae from each treatment group. Tumor region outlined in white, BM = bone marrow, T = Tumor. (B) Histomorphometric tumor volume analysis on H&E stained tibia sections. Care was taken to measure the same size tissue volume on each section. *p<0.05 and **p<0.01. (C) Osteoclast counts of TRAP stained slides from each treatment group. p = not significant, n = 10 mice per group.
Figure 5
Figure 5. Activated osteoclast measurement by bone marrow and cancer cell co-culture.
(A) Co-cultures of mouse bone marrow with MDA-231, shControl, or shEGFR-MDA-231 cells were TRAP stained to identify active osteoclasts. Four random fields were counted from two separate wells for each co-culture. **p<0.01. (B–D) Co-cultures of mouse bone marrow with MDA-231 cells, (C) bone marrow only, or (D) bone marrow with shEGFR-MDA-231 cells were treated with AREG ligand, PAR34 antibody, Control IgG antibody, or a combination of ligand with antibody as noted. Wells were TRAP stained to identify active osteoclasts, and four random fields were counted form two separate wells for each treatment. **p<0.01, ***p<0.001. (E) bone marrow only or co-cultured with MDA-231 cells were treated with 1 µM gefitinib or DMSO control for 3 days followed by TRAP staining for active osteoclasts. ***p<0.001.
Figure 6
Figure 6. shEGFR-MDA-231 cells produce smaller tumors in the mammary fat pad.
(A) Tumor volume measurement for mammary fat pad tumors grown from injection of shControl, PAR34 treated shControl cells, or shEGFR-MDA-231 cells. PAR34 treated animals were administered 10 mg/kg/week of PAR34 by intraperitoneal injection. Tumor measurements were taken three times per week. **p<0.01, n = 6 mice per group. (B) Upon sacrifice, tumor masses were assessed. **p<0.01, n = 6 mice per group. (C) Paraffin-embedded tumors were stained with anti-CD31 antibody for vessel formation (top row), black arrows denote areas of vessel staining. Ki67 staining (middle row) was examined for cellular proliferation. shEGFR-MDA-231 tumors contained large regions of necrosis, as seen in Necrosis in the bottom row. T = tumor, N = necrotic region. No necrosis was observed in shControl or PAR34 treated tumors. Vessel and proliferation counts, as well as percent changes of necrotic regions are noted in Table 1. n = 6 animals per treatment group. Magnification bars, CD31 and Ki67 = 100 µm. Necrosis = 1 mm.
Figure 7
Figure 7. MCSF-1 and MMP-9 decrease with EGFR inhibition.
(A) anti-VEGF probed western blot for MDA-231, shControl, and shEGFR-MDA-231 extracts, β-tubulin used for loading control. (B) Media was harvested from shControl or shEGFR-MDA-231 cells and analyzed for MCSF-1 by ELISA, *p<0.05. Measurements were obtained from two separate cultures, and performed in triplicate. (C) MDA-231, shControl, SUM149, or NS2TA1 cells were treated with the tyrosine kinase inhibitor PD153035 (10 µg/mL) compound for 6 hours or PAR34 (10 µg/mL) for 24 hours before media harvest for MCSF-1 ELISA, *p<0.05 and **p<0.01. Measurements were obtained from two separate cultures, and performed in triplicate. (D) anti-MMP9 antibody probed western blots for shControl, MDA-231, SUM149, or NS2TA1 cell extracts treated with PD153035 (10 µg/mL) compound for 6 hours or PAR34 (10 µg/mL) for 24 hours. shEGFR-MDA-231 cells were untreated. anti-β-tubulin used as loading control.

Similar articles

Cited by

References

    1. Wilson KJ, Gilmore JL, Foley J, Lemmon MA, Riese DJ., 2nd Functional selectivity of EGF family peptide growth factors: implications for cancer. Pharmacol Ther. 2009;122:1–8. - PMC - PubMed
    1. Gschwind A, Hart S, Fischer OM, Ullrich A. TACE cleavage of proamphiregulin regulates GPCR-induced proliferation and motility of cancer cells. Embo J. 2003;22:2411–2421. - PMC - PubMed
    1. Kochupurakkal BS, Harari D, Di-Segni A, Maik-Rachline G, Lyass L, et al. Epigen, the last ligand of ErbB receptors, reveals intricate relationships between affinity and mitogenicity. J Biol Chem. 2005;280:8503–8512. - PubMed
    1. Roepstorff K, Grandal MV, Henriksen L, Knudsen SL, Lerdrup M, et al. Differential effects of EGFR ligands on endocytic sorting of the receptor. Traffic. 2009;10:1115–1127. - PMC - PubMed
    1. Willmarth NE, Baillo A, Dziubinski ML, Wilson K, Riese DJ, 2nd, et al. Altered EGFR localization and degradation in human breast cancer cells with an amphiregulin/EGFR autocrine loop. Cell Signal. 2009;21:212–219. - PMC - PubMed

Publication types

MeSH terms