. 2012;7(1):e30312.
doi: 10.1371/journal.pone.0030312. Epub 2012 Jan 20.

Aristolochic acid I induced autophagy extenuates cell apoptosis via ERK 1/2 pathway in renal tubular epithelial cells

Affiliations

Aristolochic acid I induced autophagy extenuates cell apoptosis via ERK 1/2 pathway in renal tubular epithelial cells

Youjia Zeng et al. PLoS One. 2012.

Abstract

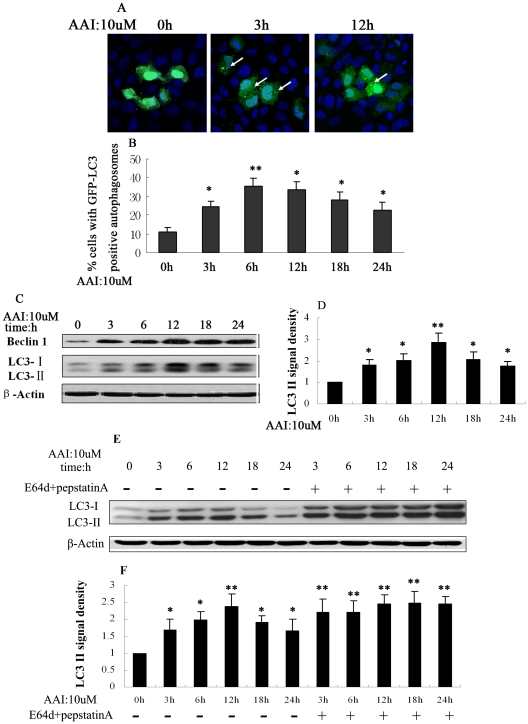
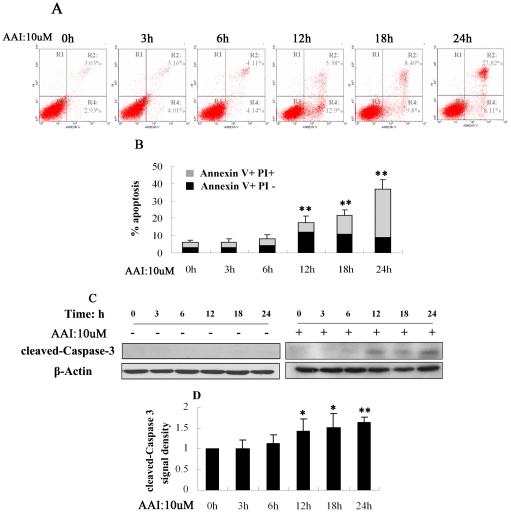
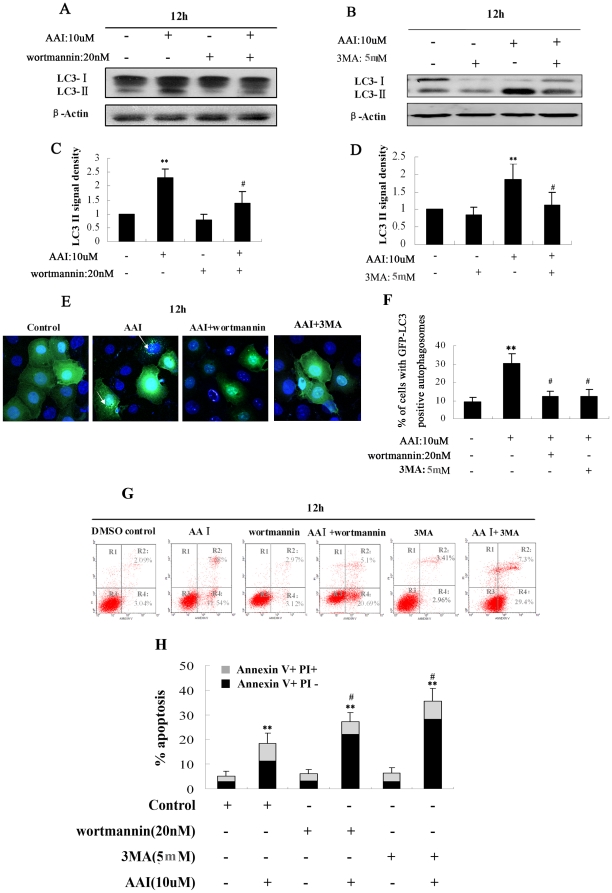
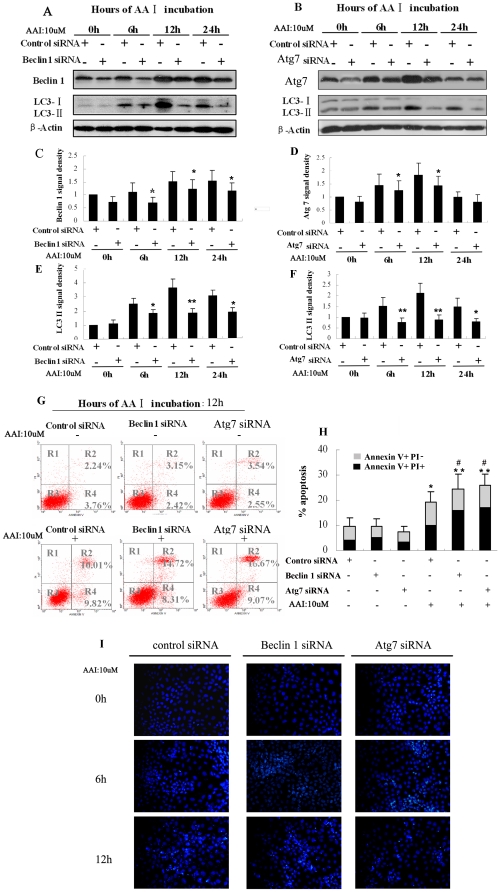
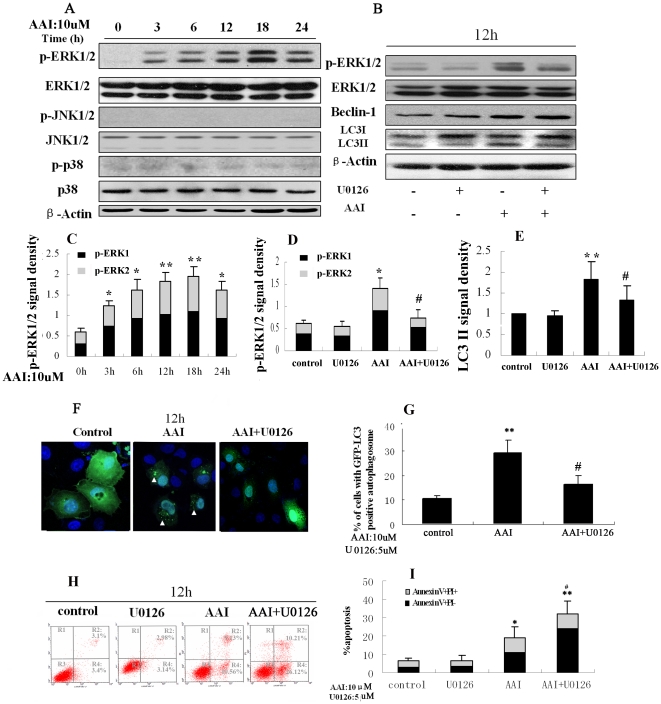
Autophagy is a lysosomal degradation pathway that is essential for cell survival and tissue homeostasis. However, limited information is available about autophagy in aristolochic acid (AA) nephropathy. In this study, we investigated the role of autophagy and related signaling pathway during progression of AAI-induced injury to renal tubular epithelial cells (NRK52E cells). The results showed that autophagy in NRK52E cells was detected as early as 3-6 hrs after low dose of AAI (10 µM) exposure as indicated by an up-regulated expression of LC3-II and Beclin 1 proteins. The appearance of AAI-induced punctated staining of autophagosome-associated LC3-II upon GFP-LC3 transfection in NRK52E cells provided further evidence for autophagy. However, cell apoptosis was not detected until 12 hrs after AAI treatment. Blockade of autophagy with Wortmannin or 3-Methyladenine (two inhibitors of phosphoinositede 3-kinases) or small-interfering RNA knockdown of Beclin 1 or Atg7 sensitized the tubular cells to apoptosis. Treatment of NRK52E cells with AAI caused a time-dependent increase in extracellular signal-regulated kinase 1 and 2 (ERK1/2) activity, but not c-Jun N-terminal kinase (JNK) and p38. Pharmacological inhibition of ERK1/2 phosphorylation with U0126 resulted in a decreased AAI-induced autophagy that was accompanied by an increased apoptosis. Taken together, our study demonstrated for the first time that autophagy occurred earlier than apoptosis during AAI-induced tubular epithelial cell injury. Autophagy induced by AAI via ERK1/2 pathway might attenuate apoptosis, which may provide a protective mechanism for cell survival under AAI-induced pathological condition.


Conflict of interest statement

Competing Interests: The authors have declared that no competing interests exist.

Figures

Figure 1
Figure 1. Autophagy induced by AAI (10 µM) in NRK-52E cells.
NRK-52E cells were transiently transfected with GFP-LC3 plasmid. After 0 to 24 hrs of AAI (10 µM) incubation, the cells were fixed and analyzed the formation and distribution of GFP-LC3 puncta by immunofluorescence. A, Representative images (×600). Arrows indicated GFP-LC3 puncta (green). Nuclei (blue) were stained by Hoechst33342. B, Percentage of cells with GFP-LC3 puncta. C, Western blot showed an increase in Beclin 1 and LC3-II at early stage of AAI incubation. D, Densitometric analysis of LC3-II in Fig. 1C. The protein expression level of control (0 hr) group was arbitrarily set as 1 in each blot, and the signals of other conditions in the same blot were normalized with the control to indicate their protein expression level. E, Western blot showed an continue increase in LC3-II with the lysosomal inhibitors E64d (10 µg/ml)+Pepstatin A (10 µg/ml) after AAI incubation. F, Densitometric analysis of LC3-II in Fig. 1E. B, D and F were expressed as means±SEM of three independent experiments. *and**denote p<0.05 and p<0.001, respectively, when compared to control condition.
Figure 2
Figure 2. Apoptosis induced by AAI (10 µM) in NRK-52E cells.
A, Representative annexinV/PI flow cytometry analysis at different AAI incubation time. The percentage of early apoptotic cells was identified with Annexin V+PI− (R4) and late apoptotic and necrotic cells was identified with AnnexinV+PI+ (R2). B, Quantitative analysis of AnnexinV+PI− and AnnexinV+PI+ NRK52E cells by flow cytometry. C, Western blot showed an increase in cleaved Caspase-3 after AAI incubation from 12 hrs to 24 hrs, while cleaved Caspase-3 didn't increase (0∼24 hrs) without AAI incubation. D, Densitometric analysis of cleaved Caspase-3 in Fig. 2C. B and D: Data was expressed as means±SEM of three independent experiments. *and**denote p<0.05 and p<0.001, respectively, when compared to control condition.
Figure 3
Figure 3. Inhibition of autophagy by Wortmannin and 3-MA increased apoptosis during AAI incubation of NRK52E cells.
NRK52E cells were incubated for 12 hrs in the absence (DMSO control), or presence of AAI (10 µM), Wortmannin (20 nM), 3 MA (5 mM) or AAI plus Wortmannin, AAI plus 3 MA. Wortmannin and 3-MA blockaded the autophagy and increased apoptosis induced by AAI. A and B: Western analysis using antibodies against LC3-II or β-Action. C and D: Densitometric analysis of LC3II in Fig. 3A and 3B. NRK52E cells were transiently transfected with GFP-LC3 plasmid, then were subjected to the same conditions as described. E, Representative images (×800). Arrows indicated GFP-LC3 puncta (green). Nuclei (blue) were stained by Hoechst33342. F, Graphs represent quantitation analysis of the percentage of cells with GFP-LC3 positive autophagosomes. G, Representative annexinV/PI flow cytometry analysis of NRK52E cells. H, Graphs represented quantitation of analysis of AnnexinV+PI− and AnnexinV+PI+ NRK52E cells by flow cytometry. C, D, F and H: Data was expressed as means±SEM of three independent experiments. *and** denote p<0.05 and p<0.001, respectively, when compared to control condition. #denote p<0.05,compared to AAI group.
Figure 4
Figure 4. Increased apoptotic and necrotic cells after knockdown of Beclin 1 or Atg7 in NRK52E cells during AAI incubation.
NRK52E cells were transiently transfected with negative control siRNA, Beclin 1 siRNA and Atg7 siRNA. The transfected cells were then treated with AAI (10 µM) for 0 to 24 hrs. A, Representative immunoblot images of Beclin 1 and LC3-II. B, Representative immunoblot images of Atg7 and LC3-II. C, Densitometric analysis of Beclin 1 in Fig. 4A. D, Densitometric analysis of Atg7 in Fig. 4B. E, Densitometric analysis of LC3II of Fig. 4A. F, Densitometric analysis of LC3II in Fig. 4B. G, Representative annexinV/PI flow cytometry analysis of negative control siRNA, Beclin 1 siRNA and Atg7 siRNA transfected cells with or without AAI treatment for 12 hrs. H, Quantitative analysis of AnnexinV+PI− and AnnexinV+PI+ NRK52E cells by flow cytometry. I, Typically morphological apoptotic cells images at different time (×600). C,D,E,F and H:Data was expressed as means±SEM of three independent experiments. *and** denote p<0.05 and p<0.001, respectively, when compared to control siRNA without AAI treatment, respectively. # denote p<0.05, when compared to control siRNA with AAI treatment.
Figure 5
Figure 5. AAI induced autophagy via activation ERK1/2 pathway.
NRK52E cells were treated with AAI (10 µM) for 0 to 24 hrs. A, Representative immunoblot images of p-ERK1/2, ERK1/2, JNK1/2, p-JNK1/2, p–p38 and p38 proteins. ERK1/2 pathway was activated at early stage, but not JNK and P38. U0126 inhibited activation of ERK1/2 pathway and accumulation of LC3II induced by AAI. NRK52E cells were incubated for 12 hrs in the absence (DMSO control), or presence of AAI (10 µM), U0126 (5 µM) or AAI plus U0126. B, Representative immunoblot images of p-ERK1/2, ERK1/2, Beclin 1 and LC3II proteins. C, Densitometric analysis of p-ERK1/2 in Fig. 5A. D, Densitometric analysis of p-ERK1/2 in Fig. 5B. E, Densitometric analysis of LC3II in Fig. 5B. F, Representative images (×800). Arrowheads indicate GFP-LC3 puncta (green). Nuclei (blue) were stained by Hoechst33342. G, Graphs represent quantitation analysis of the percentage of cells with GFP-LC3 positive autophagosomes. U0126 increased cell apoptosis induced by AAI. H, Representative annexinV/PI flow cytometry analysis of cells from DMSO control, AAI, U0126 and AAI plus U0126 groups. I, Quantitative analysis of AnnexinV+PI− and AnnexinV+PI+ NRK52E cells by flow cytometry. C,D,E,G and I: Data was expressed as means±SEM of three independent experiments. *and** denote p<0.05 and p<0.001, respectively, when compared to control condition. #denote p<0.05,compared to AAI group.

Similar articles

Cited by

References

    1. Eskelinen EL, Saftig P. Autophagy: a lysosomal degradation pathway with a central role in health and disease. Biochim Biophys Acta. 2009;1793:664–673. - PubMed
    1. Levine B, Klionsky DJ. Development by self-digestion: molecular mechanisms and biological functions of autophagy. Dev Cell. 2004;6:463–477. - PubMed
    1. Li J, Zhang L, Jiang Z, Shu B, Li F, et al. Toxicities of aristolochic acid I and aristololactam I in cultured renal epithelial cells. Toxicol In Vitro. 2010;24:1092–1097. - PubMed
    1. Yang C, Kaushal V, Shah SV, Kaushal GP. Autophagy is associated with apoptosis in cisplatin injury to renal tubular epithelial cells. Am J Physiol Renal Physiol. 2008;294:F777–F787. - PubMed
    1. Pallet N, Bouvier N, Legendre C, Gilleron J, Codogno P, et al. Autophagy protects renal tubular cells against cyclosporine toxicity. Autophagy. 2008;4:783–791. - PubMed

Publication types