

Climatic control of upwelling variability along the western North-American coast
- PMID: 22276199
- PMCID: PMC3261912
- DOI: 10.1371/journal.pone.0030436
Climatic control of upwelling variability along the western North-American coast
Abstract
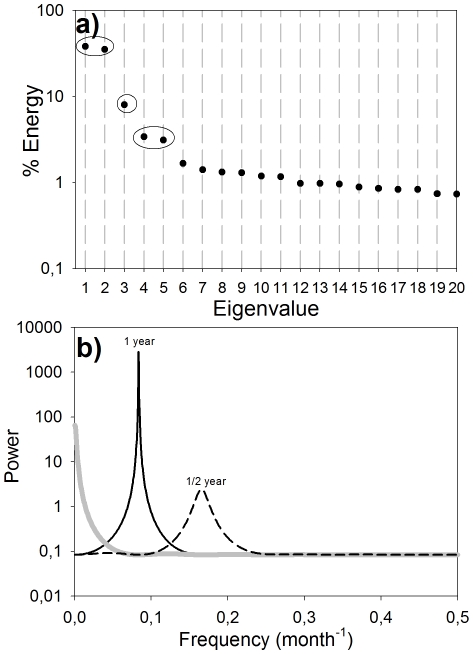
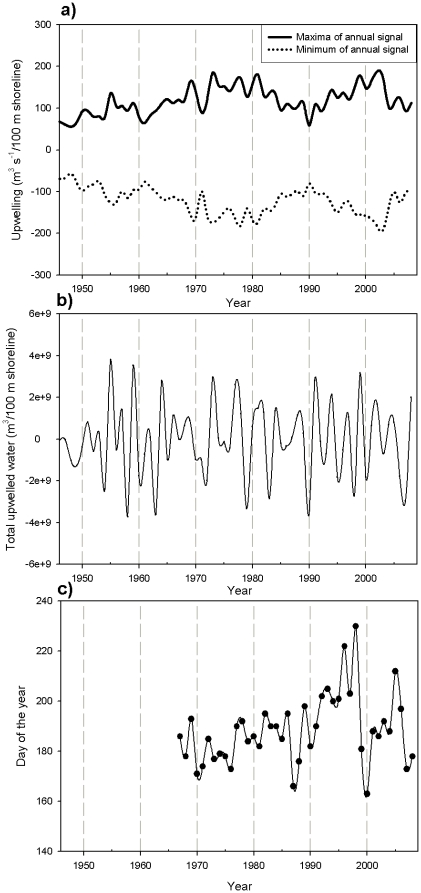
The high biological production of the California Current System (CCS) results from the seasonal development of equatorward alongshore winds that drive coastal upwelling. While several climatic fluctuation patterns influence the dynamics and biological productivity of the CCS, including the El Niño-Southern Oscillation (ENSO), the Pacific Decadal Oscillation index (PDO) and the North Pacific Gyre Oscillation (NPGO), the mechanisms of interaction between climatic oscillations and the CCS upwelling dynamics have remained obscure. Here, we use Singular Spectral Analysis (SSA) to reveal, for the first time, low-frequency concordance between the time series of climatic indices and upwelling intensity along the coast of western North America. Based on energy distributions in annual, semiannual and low-frequency signals, we can divide the coast into three distinct regions. While the annual upwelling signal dominates the energy spectrum elsewhere, low-frequency variability is maximal in the regions south of 33°N. Non-structured variability associated with storms and turbulent mixing is enhanced at northerly locations. We found that the low-frequency signal is significantly correlated with different climatic indices such as PDO, NPGO and ENSO with the correlation patterns being latitude-dependent. We also analyzed the correlations between this upwelling variability and sea surface temperature (SST) and sea level pressure (SLP) throughout the North Pacific to visualize and interpret the large-scale teleconnection dynamics in the atmosphere that drive the low-frequency coastal winds. These results provide new insights into the underlying mechanisms connecting climatic patterns with upwelling dynamics, which could enhance our prediction and forecast capabilities of the effects of future oceanographic and climatic variability in the CCS.
Conflict of interest statement
Figures


Similar articles
-
Twelve years of change in coastal upwelling along the central-northern coast of Chile: spatially heterogeneous responses to climatic variability.PLoS One. 2014 Feb 28;9(2):e90276. doi: 10.1371/journal.pone.0090276. eCollection 2014. PLoS One. 2014. PMID: 24587310 Free PMC article.
-
Influence of the El Niño-Southern Oscillation on SST Fronts Along the West Coasts of North and South America.J Geophys Res Oceans. 2022 Oct;127(10):e2022JC018479. doi: 10.1029/2022JC018479. Epub 2022 Oct 10. J Geophys Res Oceans. 2022. PMID: 36582262 Free PMC article.
-
Sea Surface Temperature Influence on Terrestrial Gross Primary Production along the Southern California Current.PLoS One. 2015 Apr 29;10(4):e0125177. doi: 10.1371/journal.pone.0125177. eCollection 2015. PLoS One. 2015. PMID: 25923109 Free PMC article.
-
Sea surface temperature variability: patterns and mechanisms.Ann Rev Mar Sci. 2010;2:115-43. doi: 10.1146/annurev-marine-120408-151453. Ann Rev Mar Sci. 2010. PMID: 21141660 Review.
-
El Niño physics and El Niño predictability.Ann Rev Mar Sci. 2014;6:79-99. doi: 10.1146/annurev-marine-010213-135026. Ann Rev Mar Sci. 2014. PMID: 24405425 Review.
Cited by
-
Understanding the causes of recent warming of mediterranean waters. How much could be attributed to climate change?PLoS One. 2013 Nov 27;8(11):e81591. doi: 10.1371/journal.pone.0081591. eCollection 2013. PLoS One. 2013. PMID: 24312322 Free PMC article.
-
Twelve years of change in coastal upwelling along the central-northern coast of Chile: spatially heterogeneous responses to climatic variability.PLoS One. 2014 Feb 28;9(2):e90276. doi: 10.1371/journal.pone.0090276. eCollection 2014. PLoS One. 2014. PMID: 24587310 Free PMC article.
-
Unraveling flow patterns through nonlinear manifold learning.PLoS One. 2014 Mar 10;9(3):e91131. doi: 10.1371/journal.pone.0091131. eCollection 2014. PLoS One. 2014. PMID: 24614890 Free PMC article.
-
Influence of the El Niño-Southern Oscillation on SST Fronts Along the West Coasts of North and South America.J Geophys Res Oceans. 2022 Oct;127(10):e2022JC018479. doi: 10.1029/2022JC018479. Epub 2022 Oct 10. J Geophys Res Oceans. 2022. PMID: 36582262 Free PMC article.
-
Macro-Scale Patterns in Upwelling/Downwelling Activity at North American West Coast.PLoS One. 2016 Nov 28;11(11):e0166962. doi: 10.1371/journal.pone.0166962. eCollection 2016. PLoS One. 2016. PMID: 27893826 Free PMC article.
References
-
- Walsh JJ. Importance of continental margins in the marine biogeochemical cycling of carbon and nitrogen. Nature. 2001;350
-
- Smith SV, Hollibaugh JT. Coastal metabolism and the oceanic organic carbon balance. Rev Geophys. 1993;31:75–89.
-
- Muller-Karger FE, Varela R, Thunell R, Luerssen R, Hu C, et al. The importance of continental margins in the global carbon cycle. Geophysical Research Letters. 2005;32:L01602.
-
- Berger WH, Smetacek VS, Wefer G. Berlin: 1989. Productivity of the ocean : present and past : report of the Dahlem Workshop on Productivity of the Ocean, Present and Past.
-
- Rebstock GA. Long-term change and stability in the California Current System: lessons from CalCOFI and other long-term data sets. Deep-Sea Research II. 2003;50:2583–2594.
Publication types
MeSH terms
LinkOut - more resources
Full Text Sources
Research Materials
