Increasing incidence of glioblastoma multiforme and meningioma, and decreasing incidence of Schwannoma (2000-2008): Findings of a multicenter Australian study
- PMID: 22276231
- PMCID: PMC3263004
- DOI: 10.4103/2152-7806.90696
Increasing incidence of glioblastoma multiforme and meningioma, and decreasing incidence of Schwannoma (2000-2008): Findings of a multicenter Australian study
Abstract
Background: The incidence of primary brain tumors by subtype is currently unknown in Australia. We report an analysis of incidence by tumor subtype in a retrospective multicenter study in the state of New South Wales (NSW) and the Australian Capital Territory (ACT), with a combined population of >7 million with >97% retention rate for medical care.
Methods: Data from histologically confirmed primary brain tumors diagnosed from January 2000 through December 2008 were weighted for patient outflow and data completeness, and age standardized and analyzed using joinpoint analysis.
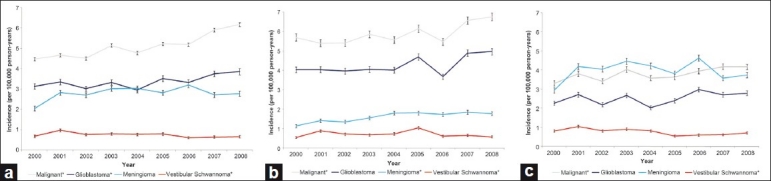
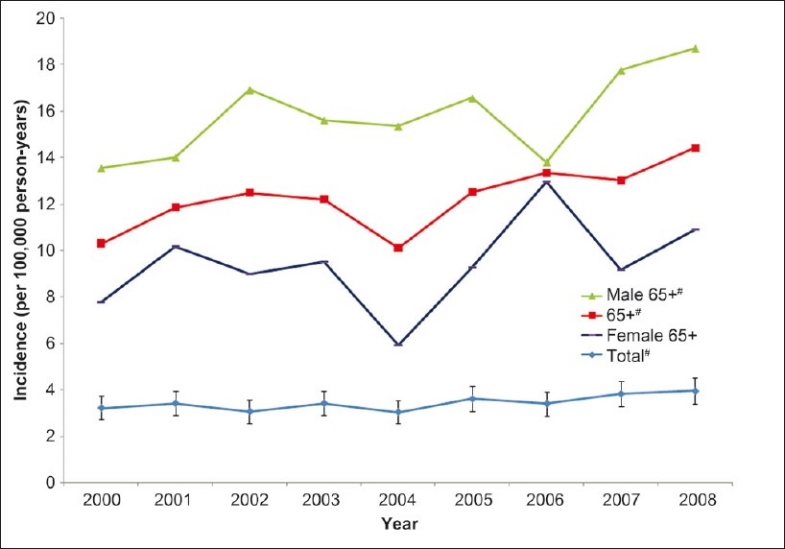
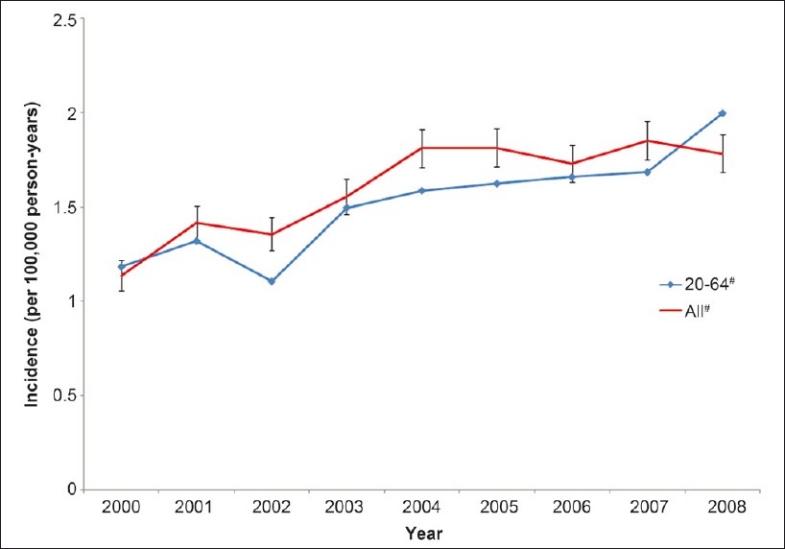
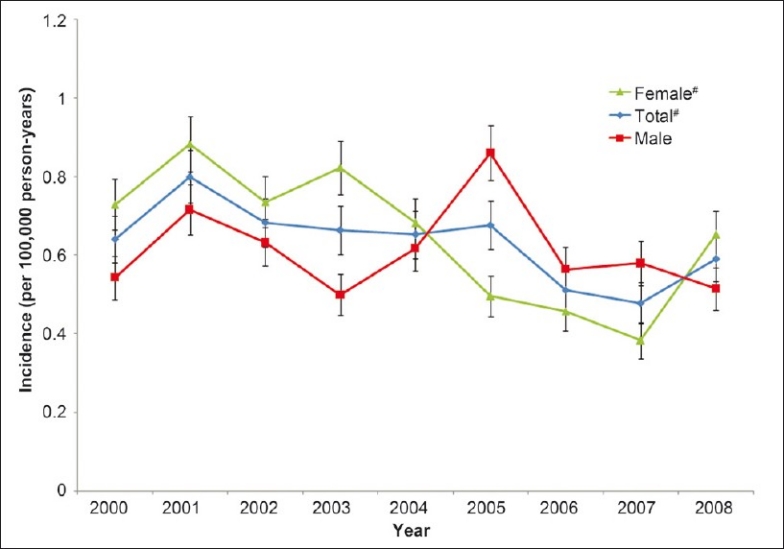
Results: A significant increasing incidence in glioblastoma multiforme (GBM) was observed in the study period (annual percentage change [APC], 2.5; 95% confidence interval [CI], 0.4-4.6, n = 2275), particularly after 2006. In GBM patients in the ≥65-year group, a significantly increasing incidence for men and women combined (APC, 3.0; 95% CI, 0.5-5.6) and men only (APC, 2.9; 95% CI, 0.1-5.8) was seen. Rising trends in incidence were also seen for meningioma in the total male population (APC, 5.3; 95% CI, 2.6-8.1, n = 515) and males aged 20-64 years (APC, 6.3; 95% CI, 3.8-8.8). Significantly decreasing incidence trends were observed for Schwannoma for the total study population (APC, -3.5; 95% CI, -7.2 to -0.2, n = 492), significant in women (APC, -5.3; 95% CI, -9.9 to -0.5) but not men.
Conclusion: This collection is the most contemporary data on primary brain tumor incidence in Australia. Our registries may observe an increase in malignant tumors in the next few years that they are not detecting now due to late ascertainment. We recommend a direct, uniform, and centralized approach to monitoring primary brain tumor incidence by subtype, including the introduction of nonmalignant data collection.
Keywords: Australia; cancer; incidence; late ascertainment; primary brain tumor.
Figures
Comment in
-
Has the incidence of brain cancer risen in Australia since the introduction of mobile phones 29 years ago?Cancer Epidemiol. 2016 Jun;42:199-205. doi: 10.1016/j.canep.2016.04.010. Epub 2016 May 5. Cancer Epidemiol. 2016. PMID: 27156022
References
-
- Australian hospital statistics 2006-07. Health services series no. 31. Cat. no. HSE 55. Canberra: AIHW; 2008. Australian Institute of Health and Welfare.
-
- Primary Brain and Central Nervous System Tumors Diagnosed in the United States in 2004-2006. Hinsdale, IL: Central Brain Tumor Registry of the United States; 2010. CBTRUS.
-
- National Program of Cancer Registries Training Materials. Atlanta, Georgia: Department of Health and Human Services; 2004. Centres for Disease Control and Prevention. Data collection of primary central nervous system tumors.
-
- Christensen HC, Kosteljanetz M, Johansen C. Incidences of gliomas and meningiomas in Denmark, 1943 to 1997. Neurosurgery. 2003;52:1327–33. discussion 1333-24. - PubMed
-
- Clegg LX, Feuer EJ, Midthune DN, Fay MP, Hankey BF. Impact of reporting delay and reporting error on cancer incidence rates and trends. J Natl Cancer Inst. 2002;94:1537–45. - PubMed
LinkOut - more resources
Full Text Sources