Independent axes of genetic variation and parallel evolutionary divergence of opercle bone shape in threespine stickleback
- PMID: 22276538
- PMCID: PMC4039416
- DOI: 10.1111/j.1558-5646.2011.01441.x
Independent axes of genetic variation and parallel evolutionary divergence of opercle bone shape in threespine stickleback
Abstract
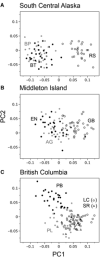
Evolution of similar phenotypes in independent populations is often taken as evidence of adaptation to the same fitness optimum. However, the genetic architecture of traits might cause evolution to proceed more often toward particular phenotypes, and less often toward others, independently of the adaptive value of the traits. Freshwater populations of Alaskan threespine stickleback have repeatedly evolved the same distinctive opercle shape after divergence from an oceanic ancestor. Here we demonstrate that this pattern of parallel evolution is widespread, distinguishing oceanic and freshwater populations across the Pacific Coast of North America and Iceland. We test whether this parallel evolution reflects genetic bias by estimating the additive genetic variance-covariance matrix (G) of opercle shape in an Alaskan oceanic (putative ancestral) population. We find significant additive genetic variance for opercle shape and that G has the potential to be biasing, because of the existence of regions of phenotypic space with low additive genetic variation. However, evolution did not occur along major eigenvectors of G, rather it occurred repeatedly in the same directions of high evolvability. We conclude that the parallel opercle evolution is most likely due to selection during adaptation to freshwater habitats, rather than due to biasing effects of opercle genetic architecture.
© 2011 The Author(s). Evolution© 2011 The Society for the Study of Evolution.
Figures


Similar articles
-
Developmental dissociation in morphological evolution of the stickleback opercle.Evol Dev. 2012 Jul;14(4):326-37. doi: 10.1111/j.1525-142X.2012.00551.x. Evol Dev. 2012. PMID: 22765204 Free PMC article.
-
Quantitative genetic variation in static allometry in the threespine stickleback.Integr Comp Biol. 2010 Dec;50(6):1067-80. doi: 10.1093/icb/icq026. Epub 2010 Apr 25. Integr Comp Biol. 2010. PMID: 21558260
-
Contemporary ancestor? Adaptive divergence from standing genetic variation in Pacific marine threespine stickleback.BMC Evol Biol. 2018 Jul 18;18(1):113. doi: 10.1186/s12862-018-1228-8. BMC Evol Biol. 2018. PMID: 30021523 Free PMC article.
-
Perspectives on the genetic architecture of divergence in body shape in sticklebacks.Integr Comp Biol. 2010 Dec;50(6):1057-66. doi: 10.1093/icb/icq030. Epub 2010 Apr 26. Integr Comp Biol. 2010. PMID: 21082067 Free PMC article. Review.
-
Adaptive evolution of lateral plates in three-spined stickleback Gasterosteus aculeatus: a case study in functional analysis of natural variation.J Fish Biol. 2010 Aug;77(2):311-28. doi: 10.1111/j.1095-8649.2010.02640.x. J Fish Biol. 2010. PMID: 20646158 Review.
Cited by
-
Developmental dissociation in morphological evolution of the stickleback opercle.Evol Dev. 2012 Jul;14(4):326-37. doi: 10.1111/j.1525-142X.2012.00551.x. Evol Dev. 2012. PMID: 22765204 Free PMC article.
-
Developmental tuning of mineralization drives morphological diversity of gill cover bones in sculpins and their relatives.Evol Lett. 2019 Jul 16;3(4):374-391. doi: 10.1002/evl3.128. eCollection 2019 Aug. Evol Lett. 2019. PMID: 31388447 Free PMC article.
-
How much can the orientation of G's eigenvectors tell us about genetic constraints?Ecol Evol. 2012 Aug;2(8):1834-42. doi: 10.1002/ece3.306. Epub 2012 Jul 4. Ecol Evol. 2012. PMID: 22957186 Free PMC article.
-
A rich diversity of opercle bone shape among teleost fishes.PLoS One. 2017 Dec 27;12(12):e0188888. doi: 10.1371/journal.pone.0188888. eCollection 2017. PLoS One. 2017. PMID: 29281662 Free PMC article.
-
Sexually mediated phenotypic variation within and between sexes as a continuum structured by ecology: The mosaic nature of skeletal variation across body regions in Threespine stickleback (Gasterosteus aculeatus L.).Ecol Evol. 2022 Oct 13;12(10):e9367. doi: 10.1002/ece3.9367. eCollection 2022 Oct. Ecol Evol. 2022. PMID: 36254299 Free PMC article.
References
-
- Aguirre WE, Ellis KE, Kusenda M, Bell MA. Phenotypic variation and sexual dimorphism in anadromous threespine stickleback: implications for postglacial adaptive radiation. Biol J Linn Soc. 2008;95:465–478.
-
- Arif S, Aguirre WE, Bell MA. Evolutionary diversification of opercle shape in Cook Inlet threespine stickleback. Biol J Linn Soc. 2009;97:832–844.
-
- Arnold SJ. Constraints on phenotypic evolution. Am Nat. 1992;140:S85–S107. - PubMed
-
- Badyaev AV, Hill GE. The evolution of sexual dimorphism in the house finch. I. Population divergence in morphological covariance structure. Evolution. 2000;54:1784–1794. - PubMed
Publication types
MeSH terms
Grants and funding
LinkOut - more resources
Full Text Sources
Other Literature Sources
