

Meta-analysis of p-wave dispersion values in healthy individuals: the influence of clinical characteristics
- PMID: 22276626
- PMCID: PMC6932421
- DOI: 10.1111/j.1542-474X.2011.00478.x
Meta-analysis of p-wave dispersion values in healthy individuals: the influence of clinical characteristics
Abstract
Background: P-wave dispersion (Pd) is an appealing marker for predicting the risk of developing atrial fibrillation. At present, no definitive cutoff value has been determined as to the diagnosis of high-risk patients. Our aims were to evaluate P-wave parameters of healthy subjects published in the literature, determine normal range and weighted means of Pd and P-wave parameters, and investigate the influences of gender, age, and BMI on the weighted results.
Methods: A systematic search of studies published in PubMed was conducted. Only studies which included control groups of healthy individuals were included.
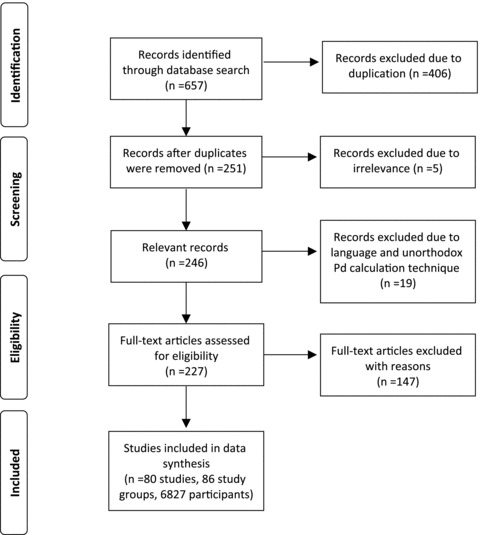
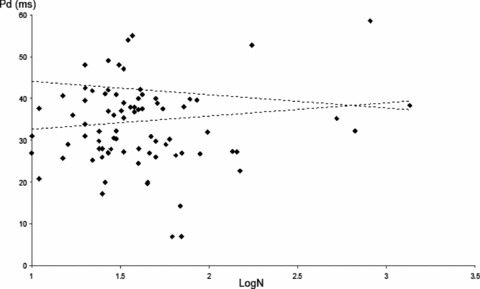
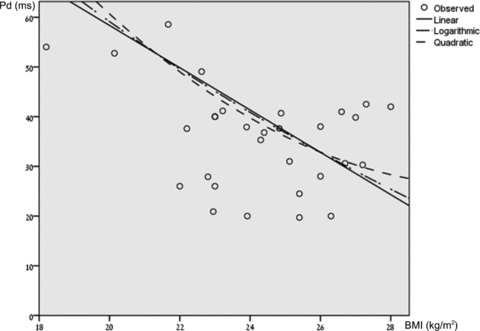
Results: Of the 657 studies initially identified, 80 were eligible for inclusion. The total number of participants was 6,827. The highest reported Pd values were 58.56 ± 16.24 ms; the lowest were 7 ± 2.7 ms. The weighted mean was 33.46 ± 9.65 ms; weighted median was 32.2 ms. Gender and age were not found to be associated with significant influences on P-wave parameter values. High-normal BMI was not found to be associated with increased P-wave parameter values.
Conclusions: Pd, Pmax, and Pmin span a wide range of values in healthy individuals. Seemingly, abnormal values were often reported in healthy adults. The high variability of P-wave parameters in healthy individuals, and overlapping of the results with those reported for patients with increased risk for atrial fibrillation, might suggest that this technique has limited sensitivity and specificity. The variability between studies may stem from methodological issues and, therefore, there is a definite need for methodological standardization of Pd measurements.
© 2012, Wiley Periodicals, Inc.
Figures
Similar articles
-
Maximum P-wave duration and P-wave dispersion predict recurrence of paroxysmal atrial fibrillation in patients with Wolff-Parkinson-White syndrome after successful radiofrequency catheter ablation.J Interv Card Electrophysiol. 2004 Aug;11(1):21-7. doi: 10.1023/B:JICE.0000035925.90831.80. J Interv Card Electrophysiol. 2004. PMID: 15273450
-
Detection of patients with hypertrophic cardiomyopathy at risk for paroxysmal atrial fibrillation during sinus rhythm by P-wave dispersion.Clin Cardiol. 2003 Sep;26(9):431-4. doi: 10.1002/clc.4960260910. Clin Cardiol. 2003. PMID: 14524601 Free PMC article.
-
Normal ranges and potential modifiers of T-wave morphology parameters among healthy individuals: A meta-analysis.Pacing Clin Electrophysiol. 2020 Jul;43(7):655-663. doi: 10.1111/pace.13918. Epub 2020 Jun 3. Pacing Clin Electrophysiol. 2020. PMID: 32285458
-
P-wave dispersion: a novel predictor of paroxysmal atrial fibrillation.Ann Noninvasive Electrocardiol. 2001 Apr;6(2):159-65. doi: 10.1111/j.1542-474x.2001.tb00101.x. Ann Noninvasive Electrocardiol. 2001. PMID: 11333174 Free PMC article. Review.
-
Atrial conduction and atrial fibrillation: what can we learn from surface ECG?Cardiol J. 2008;15(5):402-7. Cardiol J. 2008. PMID: 18810714 Review.
Cited by
-
P-wave dispersion: an indicator of cardiac autonomic dysfunction in children with neurocardiogenic syncope.Pediatr Cardiol. 2014 Apr;35(4):596-600. doi: 10.1007/s00246-013-0825-y. Epub 2013 Oct 25. Pediatr Cardiol. 2014. PMID: 24633236
-
The Effect of Glycemic Status on P Wave Dispersion.Cureus. 2024 Apr 14;16(4):e58233. doi: 10.7759/cureus.58233. eCollection 2024 Apr. Cureus. 2024. PMID: 38745813 Free PMC article.
-
Novel electrocardiographic indices of arrhythmogenesis and blood lead level.Ann Noninvasive Electrocardiol. 2017 Sep;22(5):e12395. doi: 10.1111/anec.12395. Epub 2016 Aug 18. Ann Noninvasive Electrocardiol. 2017. PMID: 27535113 Free PMC article. No abstract available.
-
Utility of P-Wave Dispersion in the Prediction of Atrial Fibrillation.Curr Health Sci J. 2017 Jan-Mar;43(1):5-11. doi: 10.12865/CHSJ.43.01.01. Epub 2017 Sep 27. Curr Health Sci J. 2017. PMID: 30595848 Free PMC article.
-
The effects of wenxin keli on p-wave dispersion and maintenance of sinus rhythm in patients with paroxysmal atrial fibrillation: a meta-analysis of randomized controlled trials.Evid Based Complement Alternat Med. 2013;2013:245958. doi: 10.1155/2013/245958. Epub 2013 Dec 4. Evid Based Complement Alternat Med. 2013. PMID: 24368925 Free PMC article. Review.
References
-
- Schneider MP, Hua TA, Bohm M, et al Prevention of atrial fibrillation by Renin‐Angiotensin system inhibition a meta‐analysis. J Am Coll Cardiol 2010;55:2299–2307. - PubMed
-
- Rosiak M, Dziuba M, Chudzik M, et al Risk factors for atrial fibrillation: Not always severe heart disease, not always so ‘lonely.’ Cardiol J 2010;17:437–442. - PubMed
-
- Nussinovitch N, Livneh A, Katz K, et al P wave dispersion in familial Mediterranean fever. Rheumatol Int 2011;31:1591–1594. - PubMed
-
- Michelucci A, Bagliani G, Colella A, et al P wave assessment: State of the art update. Card Electrophysiol Rev 2002;6:215–220. - PubMed
Publication types
MeSH terms
LinkOut - more resources
Full Text Sources
Medical
