

An evaluation of two-channel ChIP-on-chip and DNA methylation microarray normalization strategies
- PMID: 22276688
- PMCID: PMC3293711
- DOI: 10.1186/1471-2164-13-42
An evaluation of two-channel ChIP-on-chip and DNA methylation microarray normalization strategies
Abstract
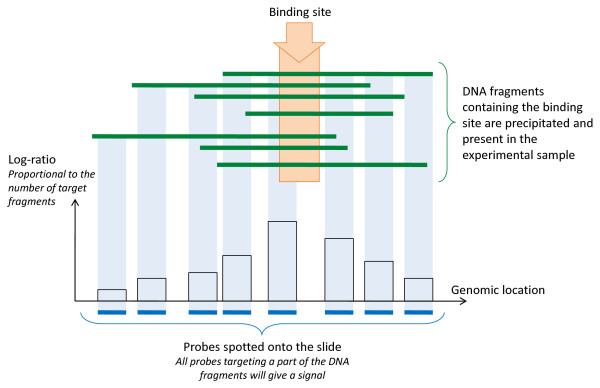
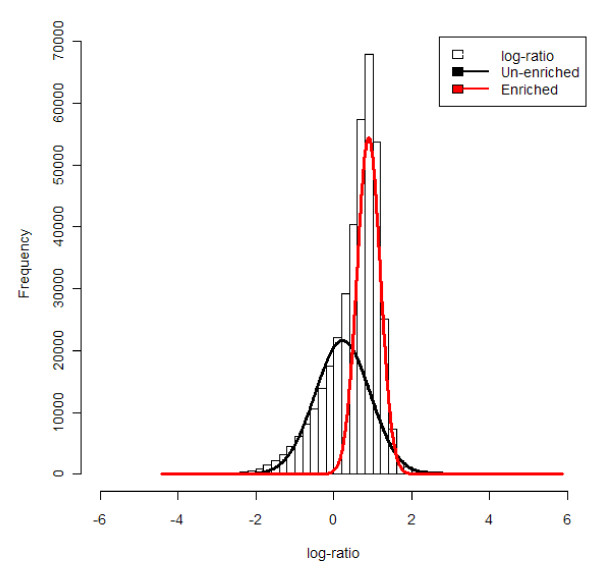
Background: The combination of chromatin immunoprecipitation with two-channel microarray technology enables genome-wide mapping of binding sites of DNA-interacting proteins (ChIP-on-chip) or sites with methylated CpG di-nucleotides (DNA methylation microarray). These powerful tools are the gateway to understanding gene transcription regulation. Since the goals of such studies, the sample preparation procedures, the microarray content and study design are all different from transcriptomics microarrays, the data pre-processing strategies traditionally applied to transcriptomics microarrays may not be appropriate. Particularly, the main challenge of the normalization of "regulation microarrays" is (i) to make the data of individual microarrays quantitatively comparable and (ii) to keep the signals of the enriched probes, representing DNA sequences from the precipitate, as distinguishable as possible from the signals of the un-enriched probes, representing DNA sequences largely absent from the precipitate.
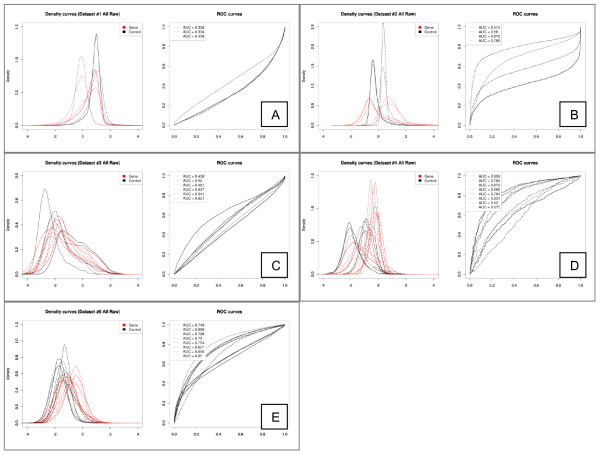
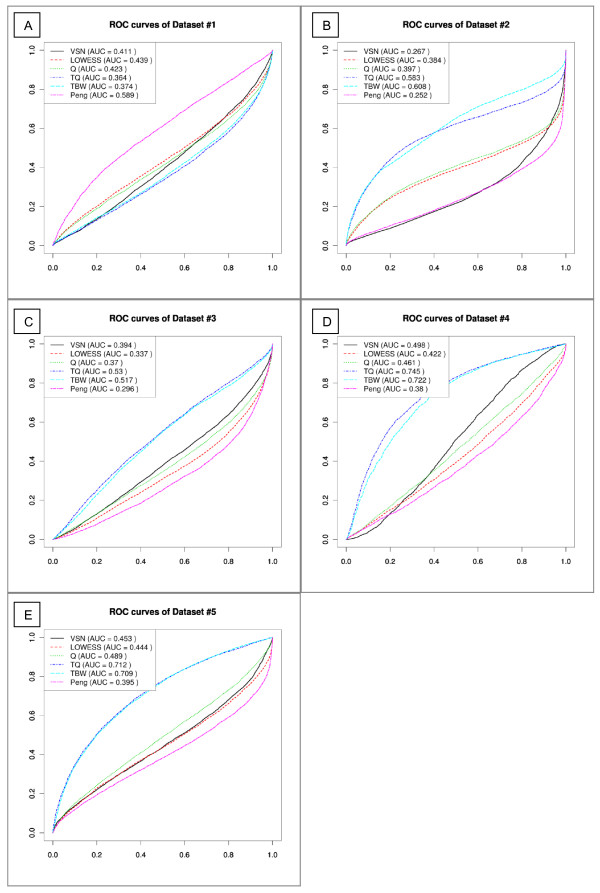
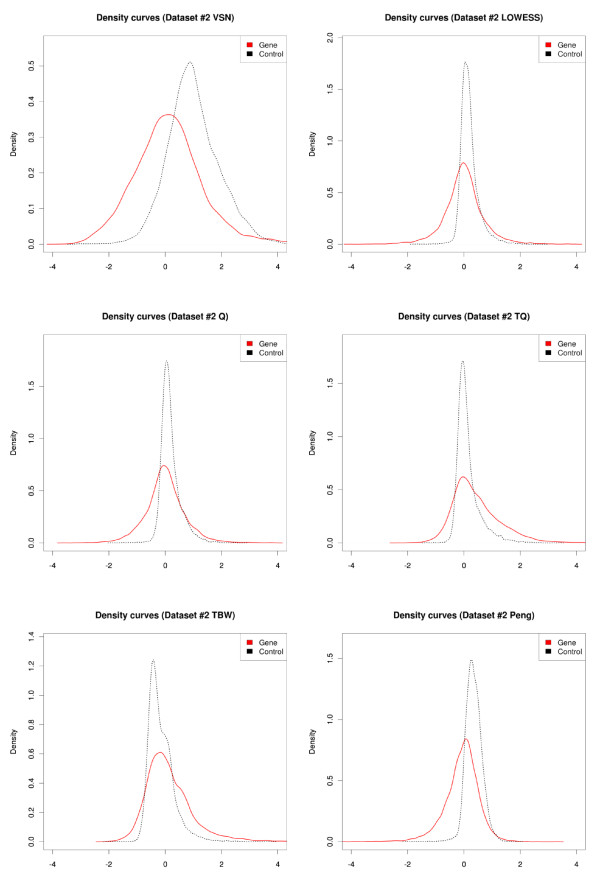
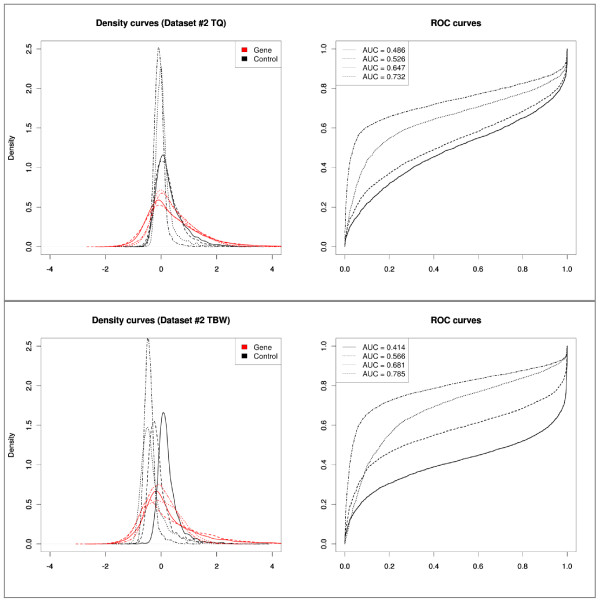
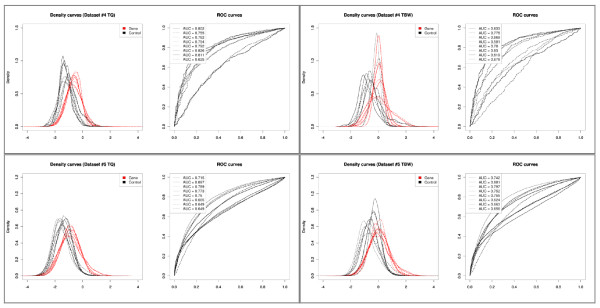
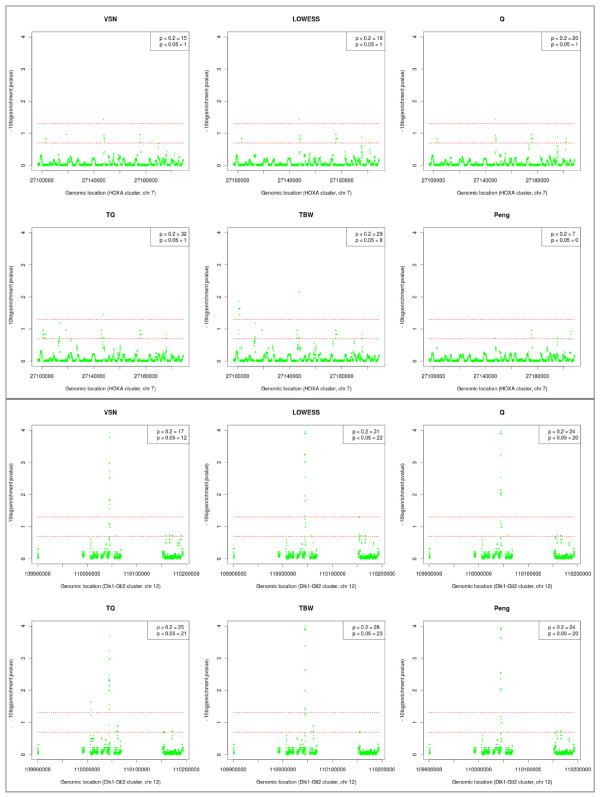
Results: We compare several widely used normalization approaches (VSN, LOWESS, quantile, T-quantile, Tukey's biweight scaling, Peng's method) applied to a selection of regulation microarray datasets, ranging from DNA methylation to transcription factor binding and histone modification studies. Through comparison of the data distributions of control probes and gene promoter probes before and after normalization, and assessment of the power to identify known enriched genomic regions after normalization, we demonstrate that there are clear differences in performance between normalization procedures.
Conclusion: T-quantile normalization applied separately on the channels and Tukey's biweight scaling outperform other methods in terms of the conservation of enriched and un-enriched signal separation, as well as in identification of genomic regions known to be enriched. T-quantile normalization is preferable as it additionally improves comparability between microarrays. In contrast, popular normalization approaches like quantile, LOWESS, Peng's method and VSN normalization alter the data distributions of regulation microarrays to such an extent that using these approaches will impact the reliability of the downstream analysis substantially.
Figures
Similar articles
-
Batch effect correction for genome-wide methylation data with Illumina Infinium platform.BMC Med Genomics. 2011 Dec 16;4:84. doi: 10.1186/1755-8794-4-84. BMC Med Genomics. 2011. PMID: 22171553 Free PMC article.
-
Complete pipeline for Infinium(®) Human Methylation 450K BeadChip data processing using subset quantile normalization for accurate DNA methylation estimation.Epigenomics. 2012 Jun;4(3):325-41. doi: 10.2217/epi.12.21. Epigenomics. 2012. PMID: 22690668
-
A Spiking Strategy for ChIP-chip Data Normalization in S. cerevisiae.Methods Mol Biol. 2017;1528:211-227. doi: 10.1007/978-1-4939-6630-1_13. Methods Mol Biol. 2017. PMID: 27854024
-
Monitoring methylation changes in cancer.Adv Biochem Eng Biotechnol. 2007;104:1-11. doi: 10.1007/10_024. Adv Biochem Eng Biotechnol. 2007. PMID: 17290816 Review.
-
Mapping the distribution of chromatin proteins by ChIP on chip.Methods Enzymol. 2006;410:316-41. doi: 10.1016/S0076-6879(06)10015-4. Methods Enzymol. 2006. PMID: 16938558 Review.
Cited by
-
Simultaneous Improvement in the Precision, Accuracy, and Robustness of Label-free Proteome Quantification by Optimizing Data Manipulation Chains.Mol Cell Proteomics. 2019 Aug;18(8):1683-1699. doi: 10.1074/mcp.RA118.001169. Epub 2019 May 16. Mol Cell Proteomics. 2019. PMID: 31097671 Free PMC article.
-
Novel technologies and emerging biomarkers for personalized cancer immunotherapy.J Immunother Cancer. 2016 Jan 19;4:3. doi: 10.1186/s40425-016-0107-3. eCollection 2016. J Immunother Cancer. 2016. PMID: 26788324 Free PMC article. Review.
-
Gene promoter DNA methylation patterns have a limited role in orchestrating transcriptional changes in the fetal liver in response to maternal folate depletion during pregnancy.Mol Nutr Food Res. 2016 Sep;60(9):2031-42. doi: 10.1002/mnfr.201600079. Epub 2016 Jun 6. Mol Nutr Food Res. 2016. PMID: 27133805 Free PMC article.
-
Methylation Landscape of Human Breast Cancer Cells in Response to Dietary Compound Resveratrol.PLoS One. 2016 Jun 29;11(6):e0157866. doi: 10.1371/journal.pone.0157866. eCollection 2016. PLoS One. 2016. PMID: 27355345 Free PMC article.
-
Epigenetics and childhood asthma: current evidence and future research directions.Epigenomics. 2012 Aug;4(4):415-29. doi: 10.2217/epi.12.32. Epigenomics. 2012. PMID: 22920181 Free PMC article. Review.
References
Publication types
MeSH terms
Substances
LinkOut - more resources
Full Text Sources
