. 2012 Jan 26;3(1):1.
doi: 10.1186/1759-8753-3-1.

Protein-DNA interactions define the mechanistic aspects of circle formation and insertion reactions in IS2 transposition

Affiliations

Protein-DNA interactions define the mechanistic aspects of circle formation and insertion reactions in IS2 transposition

Leslie A Lewis et al. Mob DNA. .

Abstract

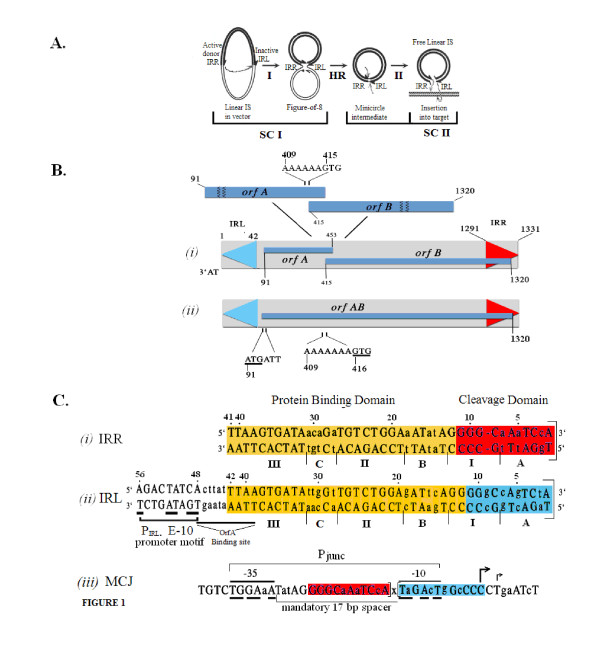
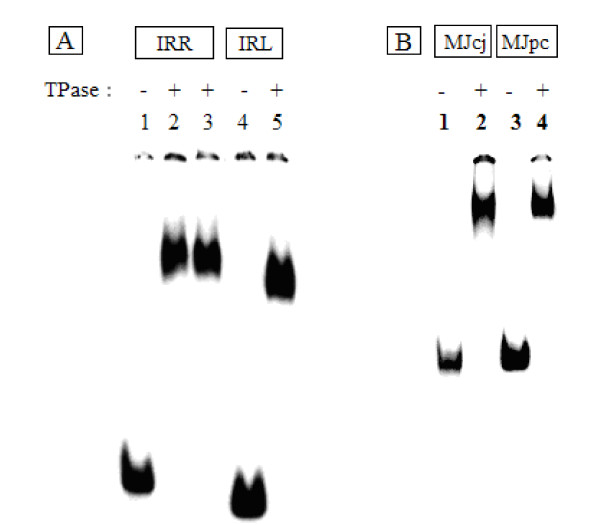
Background: Transposition in IS3, IS30, IS21 and IS256 insertion sequence (IS) families utilizes an unconventional two-step pathway. A figure-of-eight intermediate in Step I, from asymmetric single-strand cleavage and joining reactions, is converted into a double-stranded minicircle whose junction (the abutted left and right ends) is the substrate for symmetrical transesterification attacks on target DNA in Step II, suggesting intrinsically different synaptic complexes (SC) for each step. Transposases of these ISs bind poorly to cognate DNA and comparative biophysical analyses of SC I and SC II have proven elusive. We have prepared a native, soluble, active, GFP-tagged fusion derivative of the IS2 transposase that creates fully formed complexes with single-end and minicircle junction (MCJ) substrates and used these successfully in hydroxyl radical footprinting experiments.

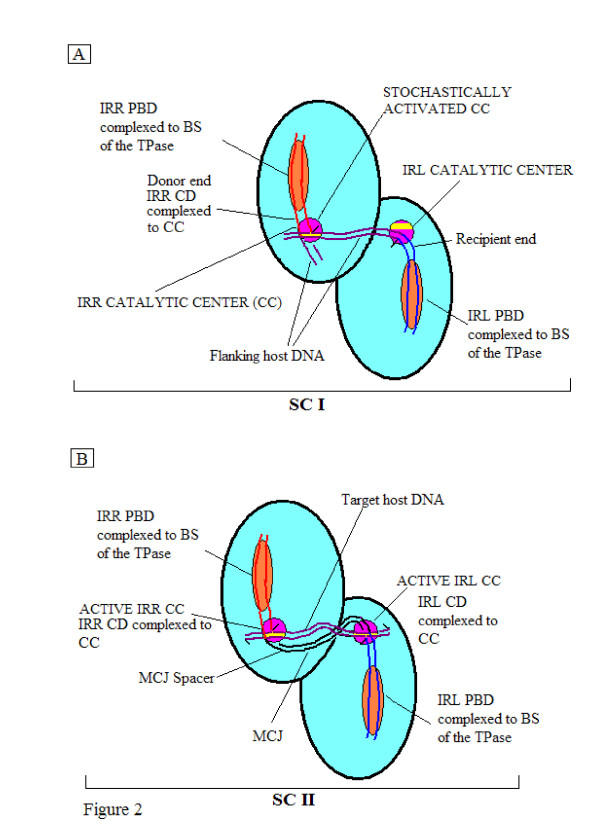
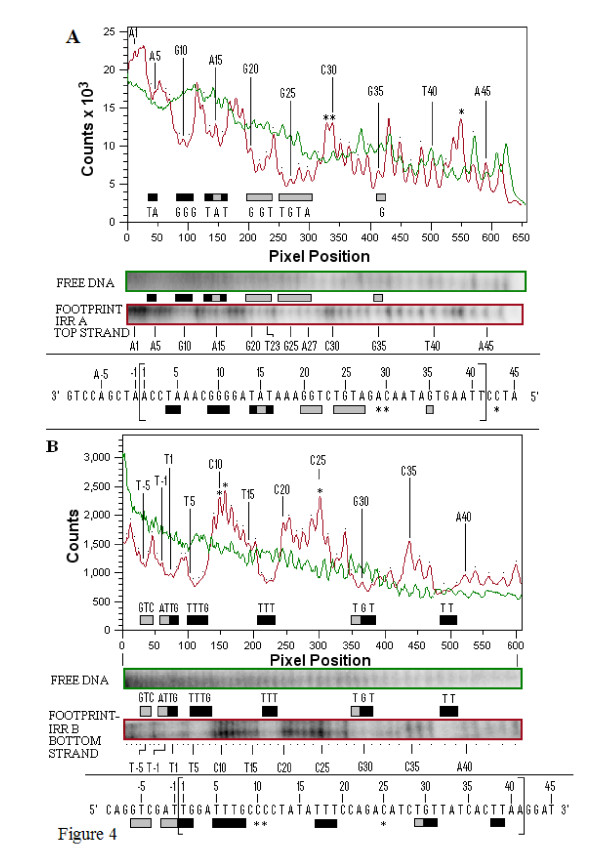
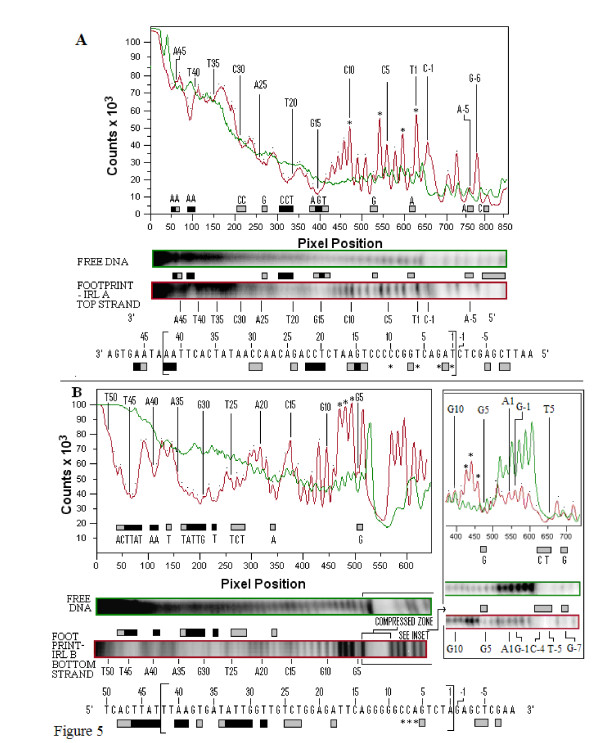
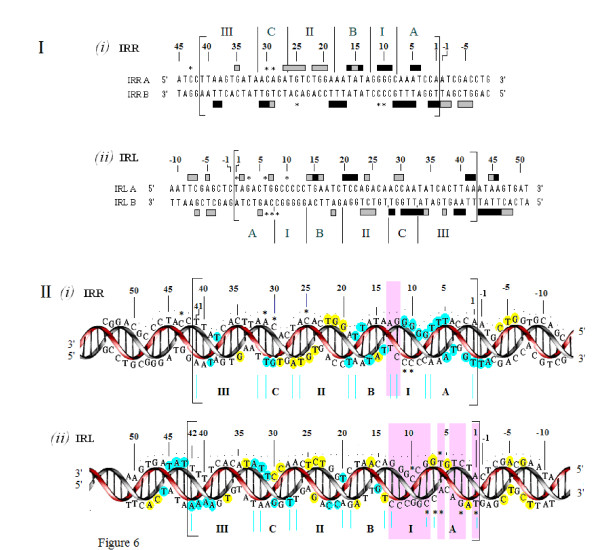
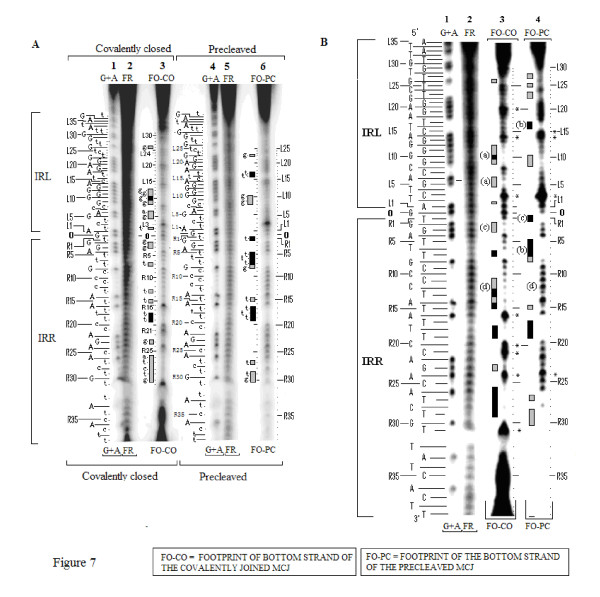
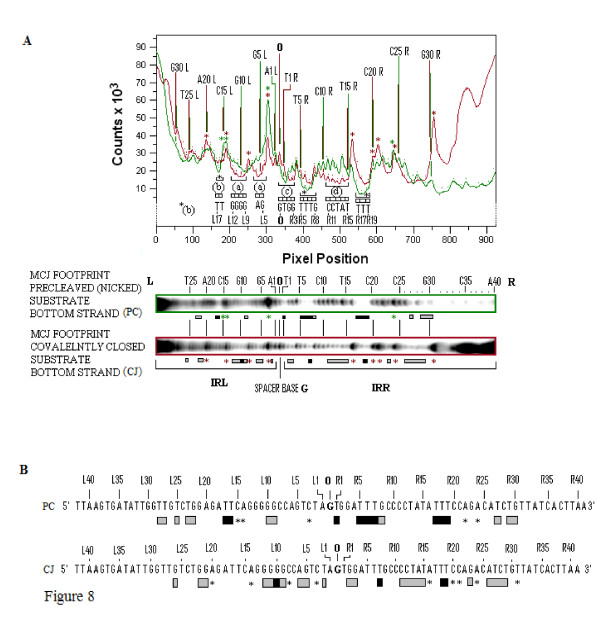
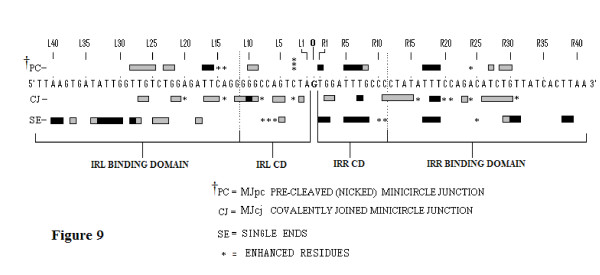
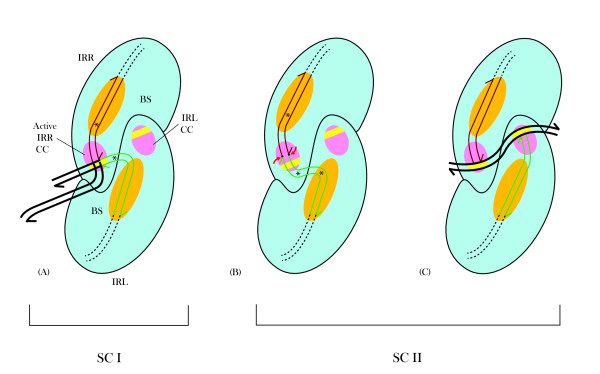
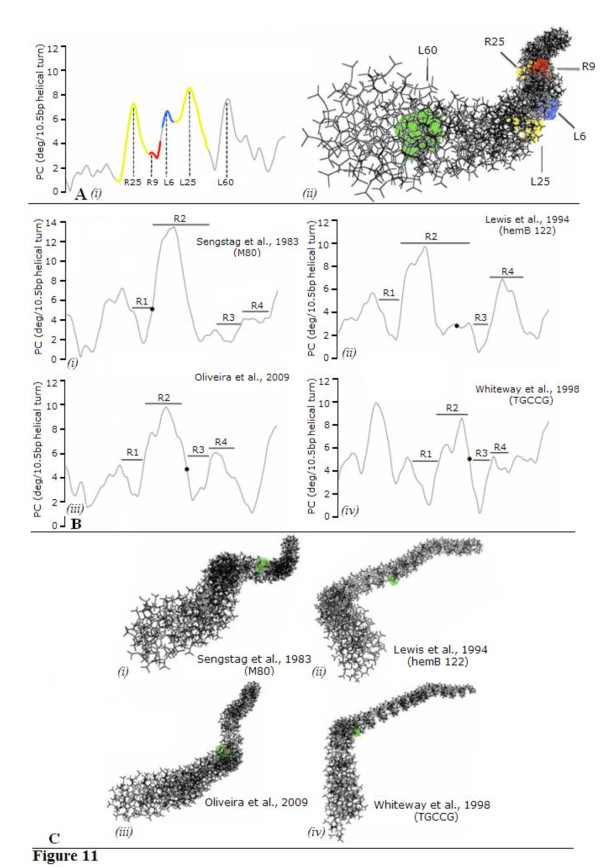
Results: In IS2, Step I reactions are physically and chemically asymmetric; the left imperfect, inverted repeat (IRL), the exclusive recipient end, lacks donor function. In SC I, different protection patterns of the cleavage domains (CDs) of the right imperfect inverted repeat (IRR; extensive in cis) and IRL (selective in trans) at the single active cognate IRR catalytic center (CC) are related to their donor and recipient functions. In SC II, extensive binding of the IRL CD in trans and of the abutted IRR CD in cis at this CC represents the first phase of the complex. An MCJ substrate precleaved at the 3' end of IRR revealed a temporary transition state with the IRL CD disengaged from the protein. We propose that in SC II, sequential 3' cleavages at the bound abutted CDs trigger a conformational change, allowing the IRL CD to complex to its cognate CC, producing the second phase. Corroborating data from enhanced residues and curvature propensity plots suggest that CD to CD interactions in SC I and SC II require IRL to assume a bent structure, to facilitate binding in trans.

Conclusions: Different transpososomes are assembled in each step of the IS2 transposition pathway. Recipient versus donor end functions of the IRL CD in SC I and SC II and the conformational change in SC II that produces the phase needed for symmetrical IRL and IRR donor attacks on target DNA highlight the differences.


Figures

Figure 1
Figure 1
Organization of the IS2 insertion sequence and its transposition pathway (modified from [31]). (A) The two-step transposition pathway of IS2. Step I (I) occurs within SC I. Asymmetric single-strand cleavage of the IRR donor is followed by transfer to the donor-inactive IRL recipient end, creating the F-8. Host replication mechanisms convert F-8 into a covalently closed double-stranded circular intermediate, the minicircle. In Step II (II) a second synaptic complex (SC II) is assembled. Cleavage at the abutted CDs results in two exposed 3'OH groups which carry out transesterification attacks on the target DNA. (B) IS2 with IRL (blue) and IRL (red) and two overlapping open reading frames, orfA and orfB, expanded to show detail of the A6G slippery codons. (i) Translational frameshifting regulates low levels of OrfAB formation; (ii) high levels of the transposase are produced by altering the window to A7G. (C) Aligned sequences of (i) IRR and (ii) IRL and (iii) the abutted ends of theMCJ. Square brackets identify the termini of IRR and IRL. (i) and (ii): conserved residues (within all elements) are in uppercase; diverged residues (within non-conserved elements A, B, C and I) are in lower case. The extended-10 promoter, PIRL, (bold underlines identify bases which match the consensus sequence) drives the events of Step I of the transposition pathway shown in panel A. Residues 39 to 48 are shown in these studies to include the binding sequence for the repressor function of Orf A [20]. (iii): abutted ends at the MCJ form a more powerful promoter (Pjunc) which indispensably controls the events in Step II. The only functional form of Pjunc contains a single base pair spacer (x) which creates its mandatory 17 base pair spacer. CD: cleavage domain; F-8: figure-of-eight; IRR/IRL: right and left inverted repeats; IS: insertion sequence; SC: synaptic complex; MCJ: minicircle junction.
Figure 2
Figure 2
Idealized schematic representations of synaptic complexes (SC I and SC II) of circle-forming insertion sequences. Each complex is shown as a dimer (aqua ovals) with a BS (orange) and a CC (purple). Each IR is complexed with its PBD (red for IRR and blue for IRL) to the BS of its monomer, and its CD bound in cis to the CC. (A) In SC I, at one stochastically activated CC (IRR in this case) the CD is cleaved at its 3' end, exposing a 3'OH group (black half arrow) which, in a transesterification reaction, attacks the host DNA (maroon; flanking the other (IRL) end), which is bound non-specifically to the CC in a tract (yellow band) designated for target or host DNA. The reaction creates the branched figure-of-eight structure (precursor of the minicircle) with an interstitial sequence of host DNA (which will become the MCJ spacer between the abutted ends) equal in length to the distance between the two CCs. (B) In SC II, the two ends are complexed as in SC I with the MCJ spacer (black) spanning the distance between two active CCs. At each activated CC the 3' end of each IR is cleaved and the exposed 3'OH groups (broken strands with black half arrows) carry out concerted transesterification attacks (yellow dots) on target DNA (maroon) which is complexed through non-specific binding to the CCs (yellow tracts). This initiates the insertion event and the resulting direct repeats which are signatures of insertion will be equal in length to the MCJ spacer. BS: binding site; CC: catalytic center; CD: cleavage domain; IRR/IRL: right and left imperfect, inverted repeats; MCJ: minicircle junction; PBD: protein binding domain; SC: synaptic complex.
Figure 3
Figure 3
Protein-DNA complexes visualized by gel retardation assays run on 5% polyacrylamide gels. For each lane, 80 nM of partially purified IS2OrfAB-GFP was reacted with 2 nM 32P-labeled annealed oligonucleotides containing cognate DNA sequences from IRR, IRL, or the minicircle junction substrates MJcj and MJpc. The reactions were incubated at room temperature (20°C) for 30 min, loaded onto the gel at 4°C and run at 120 mA. (A) Lanes 1 to 3: 87-mer IRR; 4 to 5: 79-mer IRL. Different preparations of the protein were used in lanes 2 and 3. The gel was run for 1400 Vhr. (B) Lanes 1 and 2: 114-mer MJcj; 3 and 4: MJpc. The gel was run for 920 Vhr. IRR/IRL: right and left inverted repeats; MJcj: covalently joined minicircle junction substrate; MJpc: precleaved minicircle junction substrate.
Figure 4
Figure 4
Hydroxyl radical footprinting of the top (IRRA) and bottom (IRRB) strands of the IS2 IRR. (A) Quantitative analysis panel, with tracings (derived from the color-coded gels immediately below the panel) showing relative intensities of bands from the footprinted, cleaved, bound top strand of IRR, (IRRA-red tracing) and the control, cleaved, unbound, free DNA, (green tracing). The protection profile is shown as horizontal bars within the panel identifying troughs of weakly (grey) and strongly (black) protected residues that are significantly below the green control. Determination of strong and weak protection was based on the combined analysis of visual evidence of a band and the absence or presence of peaks within the troughs. Visual absence of a band coupled with absence, or only a suggestion, of a peak defined strong protection. A faint band which showed a small peak within a trough defined weak protection. Bands and peaks are numbered (1 to 41) from the outer (3') end of IRRA to the inner end. Individual peaks are identified by dots and numbered vertical lines identify the nature of every fifth base. Asterisks identify enhanced residues whose red peaks rise significantly above those of the green control. The sequence of IRRA, shown below the panel was used to annotate the peaks in the upper panel and the bands in the color coded lanes. Nucleotides are numbered as described above. The IRR sequence within the large brackets, is flanked by host DNA at the outer (3') end of the terminus (-1 to -9) and the sequence of IS2 adjacent to the inner end of the terminus (42 to 45). (B) Quantitative analysis panel showing relative intensities of bands from the footprinted IRRB DNA (red) and the control DNA (green) derived from the gels shown immediately below the panel as described in part (a). IRR: right inverted repeat.
Figure 5
Figure 5
Hydroxyl radical footprinting of the top (IRLA) and bottom (IRLB) strands of the IS2 IRL. (A) Quantitative analysis panel showing relative intensities of bands from the footprint of IRLA (red) and the control DNA (green) as described in Figure 4. Determination of the protection profiles is as described in Figure 4. Bands and peaks are numbered (1 to 42) from the outer end of the terminus of IRR (the 5' end of the strand) to the inner end. The sequence of the top strand of IRL is shown below the panel. The IRL sequence (within large brackets and numbered as described above) is flanked by host DNA at the outer end of the terminus (-1 to -11) and the sequence of IS2 adjacent to the inner end of the terminus (43 to 50). (B) Quantitative analysis panel showing relative intensities of bands from the footprint of IRLB (red) and the control DNA (green). The zone of compression which masks the footprinting pattern from G5 to A-9 is shown more clearly in the inset. IRL: left inverted repeat.
Figure 6
Figure 6
Summary of footprinting patterns of the double-stranded right and left ends of IS2. (I) Double-stranded sequences of IRR and IRL are shown within the large brackets, numbered from the outside ends to inside ends as described in Figure 4. Protected nucleotides, strong (black) and weak (grey), (as described in Figure 4) are indicated by filled horizontal bars. Enhanced nucleotides are indicated by asterisks. Conserved and non-conserved elements are as described in Figure 1. (II) Three-dimensional representations of the protection patterns shown in part I. For IRR, the red helix represents the lower strand (IRRB- 5'TGGATT... TTAA3') and the gray helix, the upper strand (IRRA- 5'TTAA... AATCCA3'). For IRL the red helix represents the upper strand (IRLA - 5'TAG... TTAA3') and the grey helix the lower strand (IRLB- 5'TTAA... CTA3'). Strong and weak protections are shown as filled blue and yellow circles, respectively. Vertical purple shaded bars highlight the difference between the selective binding of the cleavage domain of IRL, illustrated by intermittent binding of three of the eleven nucleotides and the extensive protection of the cleavage domain of IRR with a single gap at its inner end (see text). Annotation is as described in part I. In both parts, numbering is as described in Figure 4. The inside terminus of IRL shows protection of the sequence numbered 39 to 48 that includes the proposed binding sequence for the repressor function of the OrfA protein [20]. The 5'TGAT3' sequence of base pairs 48 to 51 represents the first four bases of the weak indigenous extended-10 promoter (PIRL, see Figure 1) located adjacent to the inner end of IRL. IRR/IRL: right and left inverted repeats.
Figure 7
Figure 7
Footprinting of the bottom strands of the MJcj and MJpc substrates. Footprinting reactions were run on an 8% polyacrylamide sequencing gel together with the unbound DNA reactions (FR) and the G+A Maxam-Gilbert sequencing reactions (G+A). Vertical grey and black rectangular bars represent weakly and strongly protected residues respectively. The bands in the G+A and footprinted lanes are identified with dots and/or short horizontal lines. The DNA sequence of the bottom strand of the MCJ is shown to the left of the G+A lanes and is numbered as R1 to R39 and L1 to L37 reading from the abutted ends towards to the inside ends of the two termini. The spacer base (G) of the MCJ is numbered as 0. (A) Two hour exposure of the gel. (B) Overnight exposure of the gel facilitated the ready distinction of weak and tight binding. Bars labeled (a) identify sequences in the CD of IRL that are disengaged in the nicked (MJpc) substrate and more tightly bound in the covalently closed (MJcj) substrate. Bars labeled (b) in the CD of IRR and the PBD of IRL, indicate sequences that are more strongly protected in MJpc than in MJcj. The bars labeled (c) at the terminal trinucleotide of IRR identify differences in binding affinity to this sequence of the two substrates. The (d) labels indicate the loss of binding affinity to the PBD of IRR in the cleaved substrate compared to the covalently joined substrate bringing the protection pattern of the former more in line with that of the single IRR end (see Figure 9). CD: cleavage domain; IRR/IRL: right and left inverted repeats; MJcj: covalently joined minicircle junction substrate; MJpc: precleaved minicircle junction substrate; PBD: protein binding domain.
Figure 8
Figure 8
Quantitative comparisons of the protection patterns of the bottom strands of MJcj and MJpc substrates. (A) The top panel shows densitometer tracings of the two footprinted lanes (MJcj, red, and MJpc, green) of the sequencing gel shown in Figure 7b. The similarly color-coded boxed lanes are shown immediately below the panel. Tracings show differences in the intensities of bands from the two substrates. Annotation within the panel is based on the sequence of the bottom strand with numbering as described in Figure 7. Individual peaks in the top panel are identified by red dots for the covalently joined substrate and green dots for the nicked substrate; corresponding red and green vertical lines identify the nature and number of every fifth base. Differences in the protection patterns of the two substrates are indicated by brackets (within which the protected residues are identified) immediately beneath the troughs. Labels (a), (c) and (d) are as described in Figure 7. Brackets labeled with a black asterisk or (b) indicate sequences that are more strongly protected in MJpc than in MJcj. Enhanced residues in the two substrates are shown by sharply rising peaks and are identified by the eight red asterisks for the MJcj substrate and the four green asterisks for the MJpc substrate. (B) Consensus of the protection patterns of the bottom strand of the MJcj and MJpc substrates are derived from the data in Figures 7A, B and Figure 8A. Numbering and annotations are as described in Figure 7. Asterisks identify enhanced residues. MJcj: covalently joined minicircle junction substrate; MJpc: precleaved minicircle junction substrate.
Figure 9
Figure 9
Comparisons of protection patterns of the bottom strands of the single-end, MJcj and MJpc substrates. The sequence shown is that of the bottom strand of the MCJ with the spacer base guanine separating the abutted right and left ends. Numbering of the bases is as described in Figure 7. Protection patterns are indicated by horizontal bars. Asterisks identify enhanced residues. Three stacked asterisks describe increased enhancement. Broken vertical lines within the large brackets demarcate the IRR and IRL cleavage domains (CD) and protein binding domains (PBD). Data for residues L30 to L42 and R32 to R41 of the MCJ substrates were difficult to interpret and are not shown. CD: cleavage domain; IRR/IRL: right and left inverted repeats; MCJ: minicircle junction; MJcj: covalently joined minicircle junction substrate; MJpc: precleaved minicircle junction substrate; PBD: protein binding domain.
Figure 10
Figure 10
Schematic model for the IS2 transposition pathway. Each synaptic complex is shown as a dimer with a DNA binding site (BS; orange) to which protein binding domains (PBD) of the right and left inverted repeats (IRR, red and IRL, green) are bound, and a catalytic center (CC; pink). Each CC possesses a binding tract (orientation I), for the extensive sequence-specific binding of the cleavage domain (CD) and a tract (yellow band; orientation II), at which target or host DNA may be complexed selectively and/or non-specifically. (A) Synaptic Complex I. The CD of IRR is bound in orientation I in cis at its cognate active CC. The IRL CD is bent (asterisk) and complexed at the active CC in trans in orientation II, with adjacent host DNA (bold black lines). The 3'OH tip of the cleaved IRR CD is positioned at a 3' 5' phosphodiester bond between the first and second residues of the host DNA near the 5' end of the tip of IRL. Broken black lines represent the coding sequence of IS2. (B) Synaptic Complex II- first phase. Abutted CDs of the MCJ separated by a single base pair spacer (bold black dot), are bound in orientation I at the active IRR CC. Trans binding of the IRL CD is facilitated by two bends (asterisks), within the CD and at the outer end of the PBD. Red arrows identify sequential single-strand cleavages at the 3' ends of the CDs. (C) Synaptic Complex II- second phase. The CD of IRL, free from flanking DNA, binds to its cognate CC in orientation I. Exposed 3'OH groups at the ends of both CDs (half arrows) are juxtaposed to the target DNA, non-specifically bound (curved bold black lines) in the orientation II tracts of the CCs. BS: binding site; CC: catalytic center; CD: cleavage domain; IRR/IRL: right and left inverted repeats; MCJ: minicircle junction; PBD: protein binding domain.
Figure 11
Figure 11
Curvature analyses for the minicircle junction and IS2 target sites. (A) (i ) Predicted curvature profiles obtained by the bend.it server for a 200-bp region encompassing the MCJ. Colored regions are: IRR (yellow and red), IRL (blue and yellow), protein binding domains (yellow), cleavage domains (red and blue). Numbered base pairs correspond to the four maxima found in these regions, which also match or are located in close vicinity to enhanced residues. The maximum located at position L60 corresponds to the region harboring the indigenous PIRL promoter. (ii ) Three-dimensional representation of the region encompassing the MCJ where the five curvature maxima appear as highlighted bases. The region shaded green represents the intrinsic curvature of the PIRL promoter. (B) Predicted curvature profiles of four representative regions reported in the literature to harbor IS2 target sites. Each window represents a 200-bp fragment encompassing the target site(s) (filled circles). Regions R1 to R4 were arbitrarily chosen in order to facilitate the comparison between graphs. Although some disparity exists when comparing the relative intensity of the peaks (which results from comparing different DNA sequences), all four regions appear to be conserved. Coding references or nucleotide sequences given in brackets are in accordance with the nomenclature given in the original publication. Additional predicted curvature profiles are shown in Additional file 3. (C) Three-dimensional representations of the four regions encompassing IS2 target sites (highlighted in green). S-like (and L-like) shaped regions were preferentially obtained and intrinsic curvature was observed to occur next to the insertion site. Additional data on the three-dimensional representation of IS2 target sites can be found as Additional file 4. bp: base pair; IRR/IRL: right and left inverted repeats; MCJ: minicircle junction.

Similar articles

Cited by

References

    1. Chandler M, Mahillon J. In: Mobile DNA II. Craig NL, Craigie R, Gellert M, Lambowitz AM, editor. Washington, DC: ASM Press; 2002. Insertion sequences revisited; pp. 305–366.
    1. Rousseau P, Normand C, Loot C, Turlan C, Alazard R, Duval-Valentin G, Chandler M. In: Mobile DNA I. Craig NL, Craigie R, Gellert M, Lambowitz AM, editor. Washington, DC: ASM Press; 2002. Transposition of IS911; pp. 367–383.
    1. Duval-Valentin G, Marty-Cointin B, Chandler M. Requirement of IS911 replication before integration defines a new bacterial transposition pathway. Embo J. 2004;23:3897–3906. doi: 10.1038/sj.emboj.7600395. - DOI - PMC - PubMed
    1. Craig NL. Unity in transposition reactions. Science. 1995;270:253–254. doi: 10.1126/science.270.5234.253. - DOI - PubMed
    1. Haren L, Ton-Hoang B, Chandler M. Integrating DNA: transposases and retroviral integrases. Annu Rev Microbiol. 1999;53:245–281. doi: 10.1146/annurev.micro.53.1.245. - DOI - PubMed

LinkOut - more resources