

Protein dynamics at Eph receptor-ligand interfaces as revealed by crystallography, NMR and MD simulations
- PMID: 22277260
- PMCID: PMC3274464
- DOI: 10.1186/2046-1682-5-2
Protein dynamics at Eph receptor-ligand interfaces as revealed by crystallography, NMR and MD simulations
Abstract
Background: The role of dynamics in protein functions including signal transduction is just starting to be deciphered. Eph receptors with 16 members divided into A- and B- subclasses are respectively activated by 9 A- and B-ephrin ligands. EphA4 is the only receptor capable of binding to all 9 ephrins and small molecules with overlapped interfaces.
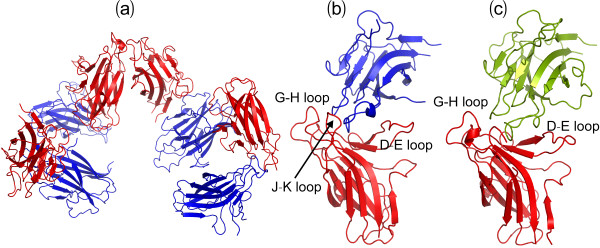
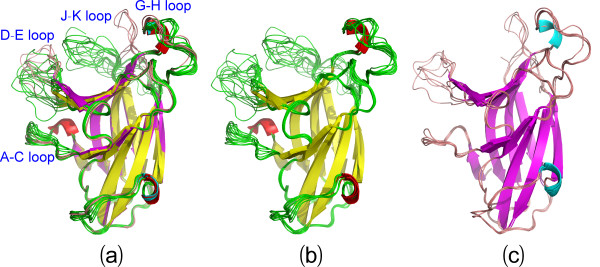
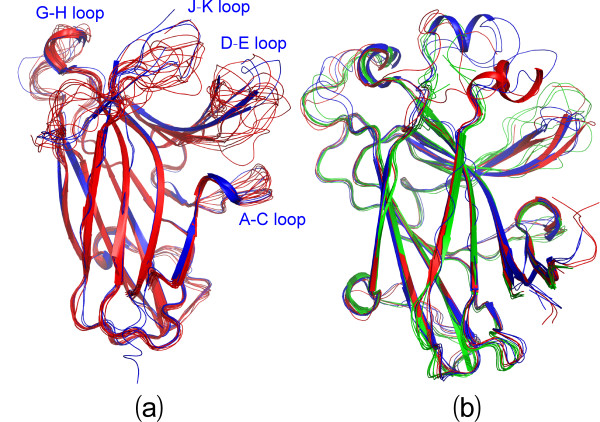
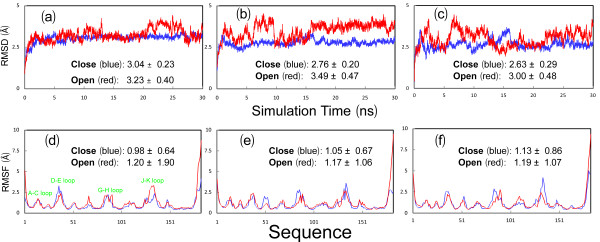
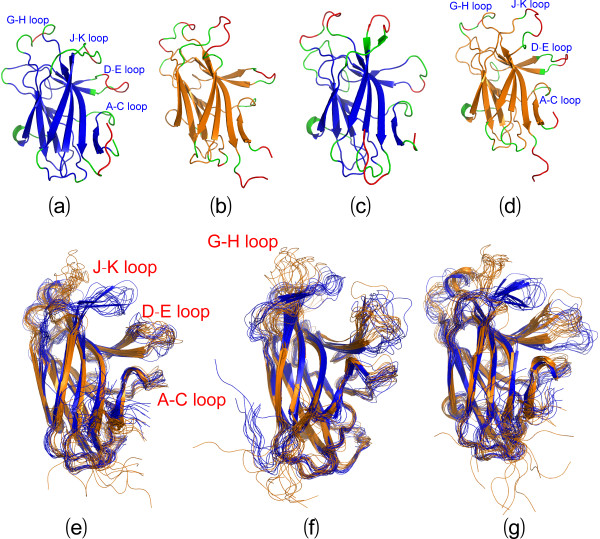
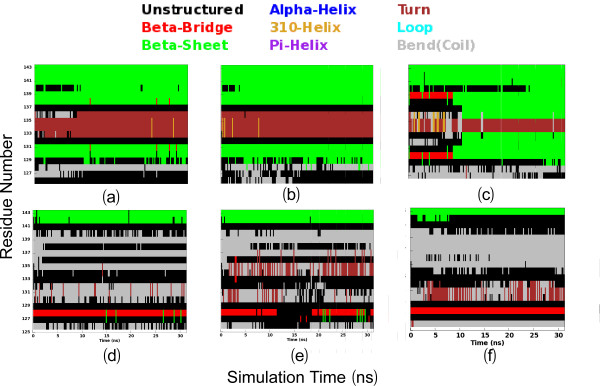
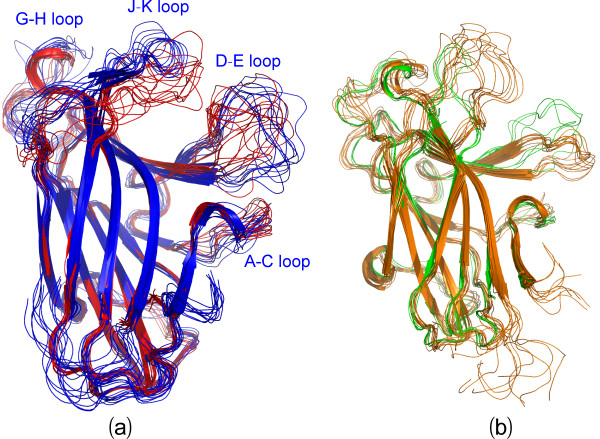
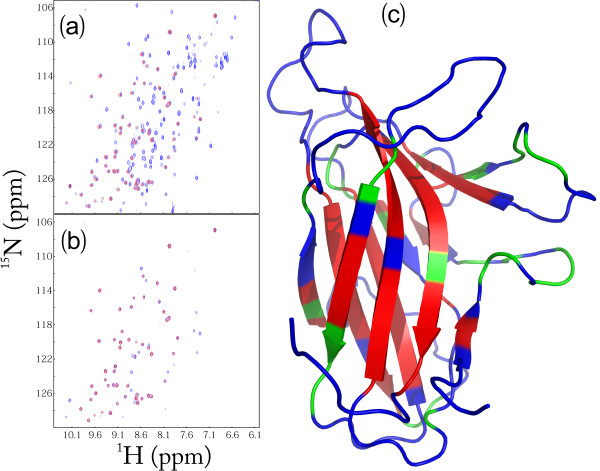
Results: We first determined the structures of the EphA4 ligand binding domain (LBD) in two crystals of P1 space group. Noticeably, 8 EphA4 molecules were found in one asymmetric unit and consequently from two crystals we obtained 16 structures, which show significant conformational variations over the functionally critical A-C, D-E, G-H and J-K loops. The 16 new structures, together with previous 9 ones, can be categorized into two groups: closed and open forms which resemble the uncomplexed and complexed structures of the EphA4 LBD respectively. To assess whether the conformational diversity over the loops primarily results from the intrinsic dynamics, we initiated 30-ns molecular dynamics (MD) simulations for both closed and open forms. The results indicate that the loops do have much higher intrinsic dynamics, which is further unravelled by NMR H/D exchange experiments. During simulations, the open form has the RMS deviations slightly larger than those of the closed one, suggesting the open form may be less stable in the absence of external contacts. Furthermore, no obvious exchange between two forms is observed within 30 ns, implying that they are dynamically separated.
Conclusions: Our study provides the first experimental and computational result revealing that the intrinsic dynamics are most likely underlying the conformational diversity observed for the EphA4 LBD loops mediating the binding affinity and specificity. Interestingly, the open conformation of the EphA4 LBD is slightly unstable in the absence of it natural ligand ephrins, implying that the conformational transition from the closed to open has to be driven by the high-affinity interaction with ephrins because the weak interaction with small molecule was found to be insufficient to trigger the transition. Our results therefore highlight the key role of protein dynamics in Eph-ephrin signalling and would benefit future design of agonists/antagonists targeting Eph receptors.
Figures
Similar articles
-
Unique structure and dynamics of the EphA5 ligand binding domain mediate its binding specificity as revealed by X-ray crystallography, NMR and MD simulations.PLoS One. 2013 Sep 24;8(9):e74040. doi: 10.1371/journal.pone.0074040. eCollection 2013. PLoS One. 2013. PMID: 24086308 Free PMC article.
-
Crystal structure and NMR binding reveal that two small molecule antagonists target the high affinity ephrin-binding channel of the EphA4 receptor.J Biol Chem. 2008 Oct 24;283(43):29473-84. doi: 10.1074/jbc.M804114200. Epub 2008 Aug 14. J Biol Chem. 2008. PMID: 18708347 Free PMC article.
-
Insights into Eph receptor tyrosine kinase activation from crystal structures of the EphA4 ectodomain and its complex with ephrin-A5.Proc Natl Acad Sci U S A. 2013 Sep 3;110(36):14634-9. doi: 10.1073/pnas.1311000110. Epub 2013 Aug 19. Proc Natl Acad Sci U S A. 2013. PMID: 23959867 Free PMC article.
-
Roles of Eph receptors and ephrins in segmental patterning.Philos Trans R Soc Lond B Biol Sci. 2000 Jul 29;355(1399):993-1002. doi: 10.1098/rstb.2000.0635. Philos Trans R Soc Lond B Biol Sci. 2000. PMID: 11128993 Free PMC article. Review.
-
Ectodomain structures of Eph receptors.Semin Cell Dev Biol. 2012 Feb;23(1):35-42. doi: 10.1016/j.semcdb.2011.10.025. Epub 2011 Oct 24. Semin Cell Dev Biol. 2012. PMID: 22044883 Review.
Cited by
-
Dynamic conformational switching in the chemokine ligand is essential for G-protein-coupled receptor activation.Biochem J. 2013 Dec 1;456(2):241-51. doi: 10.1042/BJ20130148. Biochem J. 2013. PMID: 24032673 Free PMC article.
-
Protein dynamics and conformational selection in bidirectional signal transduction.BMC Biol. 2012 Jan 25;10:2. doi: 10.1186/1741-7007-10-2. BMC Biol. 2012. PMID: 22277130 Free PMC article.
-
An investigation of binding interactions of tumor-targeted peptide conjugated polyphenols with the kinase domain of ephrin B4 and B2 receptors.Mol Divers. 2024 Apr;28(2):817-849. doi: 10.1007/s11030-023-10621-x. Epub 2023 Feb 27. Mol Divers. 2024. PMID: 36847923 Free PMC article.
-
Modeling Catalysis in Allosteric Enzymes: Capturing Conformational Consequences.Top Catal. 2022 Feb;65(1-4):165-186. doi: 10.1007/s11244-021-01521-1. Epub 2021 Nov 9. Top Catal. 2022. PMID: 36304771 Free PMC article.
-
Tie2 and Eph receptor tyrosine kinase activation and signaling.Cold Spring Harb Perspect Biol. 2014 Mar 1;6(3):a009142. doi: 10.1101/cshperspect.a009142. Cold Spring Harb Perspect Biol. 2014. PMID: 24478383 Free PMC article. Review.
References
LinkOut - more resources
Full Text Sources
Other Literature Sources
Miscellaneous
