. 2012 May;37(6):1323-37.
doi: 10.1038/npp.2011.317. Epub 2012 Jan 25.

Intranasally administered neuropeptide S (NPS) exerts anxiolytic effects following internalization into NPS receptor-expressing neurons

Affiliations

Intranasally administered neuropeptide S (NPS) exerts anxiolytic effects following internalization into NPS receptor-expressing neurons

Irina A Ionescu et al. Neuropsychopharmacology. 2012 May.

Abstract

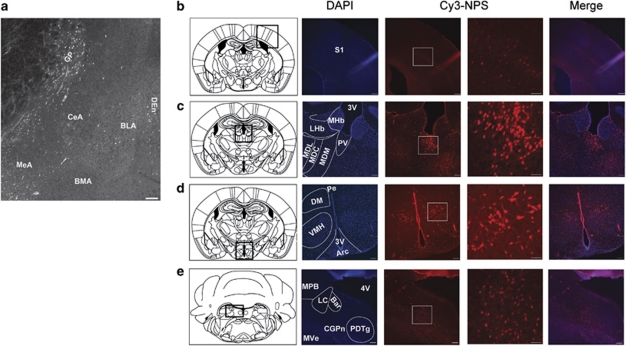
Experiments in rodents revealed neuropeptide S (NPS) to constitute a potential novel treatment option for anxiety diseases such as panic and post-traumatic stress disorder. However, both its cerebral target sites and the molecular underpinnings of NPS-mediated effects still remain elusive. By administration of fluorophore-conjugated NPS, we pinpointed NPS target neurons in distinct regions throughout the entire brain. We demonstrated their functional relevance in the hippocampus. In the CA1 region, NPS modulates synaptic transmission and plasticity. NPS is taken up into NPS receptor-expressing neurons by internalization of the receptor-ligand complex as we confirmed by subsequent cell culture studies. Furthermore, we tracked internalization of intranasally applied NPS at the single-neuron level and additionally demonstrate that it is delivered into the mouse brain without losing its anxiolytic properties. Finally, we show that NPS differentially modulates the expression of proteins of the glutamatergic system involved inter alia in synaptic plasticity. These results not only enlighten the path of NPS in the brain, but also establish a non-invasive method for NPS administration in mice, thus strongly encouraging translation into a novel therapeutic approach for pathological anxiety in humans.


Figures

Figure 1
Figure 1
Representative selection of mouse brain regions targeted by ICV-administered fluorescent Cy3-NPS. (a) Amygdaloid structures (Cy3-NPS: bright white): Central amygdala (CeA), medial amygdala (MeA), basolateral amygdala (BLA), basomedial amygdala (BMA). Cortical structures: Dorsal endopiriform cortex (DEn). Basal ganglia: Globus pallidus (GP). Scale bar, 200 μm. (b–e) The leftmost panels show a schematic overview of murine brain regions (Franklin and Paxinos, 2007). The middle panels show the nuclear counterstain DAPI (blue) (scale bar, 100 μm) and cell populations having taken up Cy3-NPS (red). The images in the red channel are presented in two different magnifications (scale bars, 100 and 10 μm)—white rectangles indicate the area of magnification. The rightmost panels show an overlay of the blue and red channels (scale bar, 100 μm). (b) Cortical structures: Primary somatosensory cortex (S1). (c) Thalamic structures: Paraventricular thalamic nucleus (PV); sporadically in medial habenula (MHb); lateral habenula (LHb); mediodorsal thalamic nucleus (MD): medial (MDM), central (MDC), and lateral (MDL). Third ventricle (3V). (d) Hypothalamic structures: Periventricular hypothalamic nucleus (Pe), dorsomedial hypothalamic nucleus (DM), ventromedial hypothalamic nucleus (VMH), arcuate hypothalamic nucleus (Arc). Third ventricle (3V). (e) Brainstem structures: Central gray of the pons (CGPn), medial vestibular nucleus (MVe), sporadically in posterodorsal tegmental nucleus (PDTg), Barrington's nucleus (Bar), sporadically in locus coeruleus (LC) and in medial parabrachial nucleus (MPB). Fourth ventricle (4V). All images were acquired with a confocal microscope and are representative for a total of 10 mice. See Table 1 for a complete list of brain regions where uptake of Cy3-NPS was detected.
Figure 2
Figure 2
Analysis of cell types targeted by Cy3-NPS. (a) A representative overview image of the hippocampus. Scale bar, 100 μm. (b) Morphologically representative cells from the granular dentate gyrus. Granular dentate gyrus (GrDG), molecular dentate gyrus (MoDG). Scale bar, 20 μm. Z-stack of 15 images in 0.59-μm intervals. (c) Co-staining with the neuronal marker NF (green). This representative image was taken from the dentate gyrus. Scale bar, 20 μm. Z-stack of 10 images in 1-μm intervals. (d) The hippocampal CA3 region after co-staining with GFAP (green), an astroglial marker. Z-stack of 18 images in 1-μm intervals. Scale bar, 20 μm. (e) Dentate gyrus after co-staining with the microglial marker Iba-1 (green). Z-stack of 19 slices in 1-μm intervals. Scale bar, 20 μm. Cy3-NPS: Red; nuclear counterstain DAPI: Blue. All images (a–e) were acquired with a confocal microscope and are representative for a total of 10 mice.
Figure 3
Figure 3
Analysis of the specificity of Cy3-NPS uptake in vivo and in vitro, and intracerebral distribution of Cy3-NPS after intranasal application. (a) From left to right: Coronal sections through mouse brain (overview (Franklin and Paxinos, 2007)) with and without pre-injection of native NPS at fivefold concentration 10 min before ICV administration of Cy3-NPS, and after co-injection with the NPSR antagonists [D-Cys(tBu)5]Neuropeptide S and (R)-SHA 68 at 150-fold concentration. Posteroventral nucleus of the medial amygdala (MePV), cortical amygdala (ACo). Optic tract (opt). Additional brain regions are depicted in Supplementary Figure S3 for comparison. All images are representative for a total of four mice pre-treated with native NPS before ICV administration of Cy3-NPS and a total of three mice co-treated with the antagonists. (b) HEK cells transiently transfected with EGFP-NPSR (green) after 10 min of incubation with Cy3-NPS (red). Nuclear counterstain: DAPI (blue). The rightmost panel depicts an overlay of all three channels and shows colocalization of Cy3-NPS and EGFP-NPSR (yellow) in cytoplasmic (arrows) and perinuclear (arrowheads) vesicular structures. All images were taken with a confocal microscope. Scale bars, 20 μm. (c) Intraneuronal uptake of Cy3-NPS (red) 30 min after intranasal delivery shown exemplarily in the hippocampus. DAPI (blue). Left: Hippocampal neuron from the oriens layer (CA3 region). Z-stack of 10 images in 1-μm intervals. Right: Hippocampal neuron from the pyramidal layer (CA3 region) after NF staining (green). Scale bars, 20 μm. All images were taken with a confocal microscope and are representative for a total of three mice.
Figure 4
Figure 4
Effects of NPS on synaptic transmission and plasticity in the ventral hippocampus. (a) An overview picture of a horizontal slice of the ventral hippocampus, with the position of the stimulation (Stim) and recording (Rec) electrode. DG, dentate gyrus. (b) Paired-pulse facilitation at CA3–CA1 synapses in control (n=10), NPS-treated (n=13), and NPS+(R)-SHA 68-treated (n=11) slices. Newman–Keuls post-hoc test showed a significant decrease in the paired-pulse ratio after NPS treatment, on the one hand compared with control or NPS+(R)-SHA 68-treated slices and on the other hand for every ISI (400-ms control vs NPS, p=0.0049, and NPS vs NPS+(R)-SHA 68, p=0.006; for every other ISI, p<0.001). (c) NPS decreases LTP at CA3–CA1 synapses through NPSR. fEPSP, field excitatory postsynaptic potential (Bonferroni's post-hoc test: control vs NPS, p=0.049; NPS vs NPS+(R)-SHA 68, p<0.001). HFS, high-frequency stimulation (control, n=8; NPS, n=10; NPS+(R)-SHA 68, n=10). *p<0.05, **p<0.01, ***p<0.001. All data are shown as mean±SEM.
Figure 5
Figure 5
Behavioral effects of transnasally delivered NPS in C57BL/6N and in HAB mice. (a) Behavioral testing of C57BL/6N mice 4 h after intranasal NPS treatment (7, 14, and 28 nmol) in open field, dark–light test, and EPM (n=10). Statistical analysis: One-way ANOVA with Bonferroni's post-hoc test. The data are shown as % change relative to control. (b) Behavioral testing of HAB mice 4 h after intranasal NPS treatment (14 nmol) in open field, dark–light test, and EPM (n=10). Statistical analysis: Two-tailed unpaired t-test. (c) Behavioral testing of C57BL/6N mice and HAB mice 30 min after intranasal NPS treatment (14 nmol) in open field, dark–light test, and EPM (n=10). Statistical analysis: Two-tailed unpaired t-test. C57BL/6N mice: Total distance traveled in open field: t=0.6222, df=17, p=0.2710; % time spent in light chamber: t=0.4437, df=18, p=0.3313; latency to first entry in light chamber: t=1.190, df=18, p=0.1247; % distance traveled in light chamber: p=0.1007, t=1.326, df=18; % time spent on the open arm: p=0.2109, t=0.8219, df=18; entries in closed arm: p=0.4721, t=0.07093, df=18. HAB mice: Total distance traveled in open field: p=0.2198, t=0.7905, df=18; % time spent in light chamber: p=0.3856, t=0.2953, df=18; latency to first entry in light chamber: p=0.4085, t=0.2348, df=18; % distance traveled in light chamber: p=0.4524, t=0.1214, df=18; % time spent on the open arm: p=0.2459, t=0.7009, df=19; entries in closed arm: p=0.4081, t=0.2356, df=19. tp<0.1, *p<0.05. All data are shown as mean±SEM.
Figure 6
Figure 6
Effects of transnasally delivered NPS (14 nmol) 4 h after application on protein and mRNA levels in the prefrontal cortex and hippocampus of C57BL/6N mice. (a) Immunoblot analysis of hippocampal (Hc) lysate from C57BL/6N mice 4 h after intranasal NPS treatment. GluR1: t=1.192, df=8, p=0.2675; GluR2: t=0.657, df=8, p=0.5552; Glt-1: t=0.02711, df=8, p=0.9790; synapsin Ia–b/IIa: t=1.506, df=6, p=0.1828. (b) Real-time PCR analysis of Hc lysate from C57BL/6N mice 4 h after intranasal NPS treatment. GluR1: t=1.236, df=7, p=0.2562; GluR2: t=1.242, df=8, p=0.2493; synapsin I: t=0.3580, df=4, p=0.7385; synapsin II: t=1.243, df=7, p=0.2540. (c) Immunoblot analysis of prefrontal cortex (Pfc) lysate from C57BL/6N mice 4 h after intranasal NPS treatment. GluR1: t=0.1030, df=8, p=0.9205; GluR2: t=0.8469, df=8, p=0.4217; Glt-1: t=0.03901, df=8, p=0.9698; synapsin Ia–b/IIa: t=1.384, df=6, p=0.2038. (d) Real-time PCR analysis of Pfc lysate from C57BL/6N mice 4 h after intranasal NPS treatment. GluR1: t=0.7166, df=5, p=0.5057; GluR2: t=0.6839, df=8, p=0.5133; synapsin I: t=1.063, df=7, p=0.3230. Internal expression control: GAPDH (35 kDa in immunoblot excerpts). The blot excerpts show three representative adjacent bands of each group. The immunoblot data represent cumulated data from at least three independent experiments. C57BL/6N: n=5 for each group. Statistical analysis: Two-tailed unpaired t-test. tp<0.1, *p<0.05, **p<0.01. All data are shown as mean±SEM.
Figure 7
Figure 7
Effects of transnasally delivered NPS (14 nmol) 4 h after application on mRNA levels in the prefrontal cortex and hippocampus of HAB mice. (a) Real-time PCR analysis of Hc lysate from HAB mice 4 h after intranasal NPS treatment. GluR2: t=1.540, df=8, p=0.1620; synapsin I: t=1.123, df=8, p=0.2940; synapsin II: t=1.339, df=5, p=0.2383. (b) Real-time PCR analysis of Pfc lysate from HAB mice 4 h after intranasal NPS treatment. GluR1: t=0.7371, df=7, p=0.4850; GluR2: t=0.7957, df=8, p=0.4492; Glt-1: t=0.2440, df=7, p=0.8143; synapsin I: t=0.8174, df=8, p=0.4373; synapsin II: t=0.4126, df=8, p=0.6907. HAB: n=5 for each group. Statistical analysis: Two-tailed unpaired t-test. tp<0.1, *p<0.05. All data are shown as mean±SEM.
Figure 8
Figure 8
Effects of transnasally delivered NPS (14 nmol) 24 h after application on protein levels in the prefrontal cortex and hippocampus of C57BL/6N and HAB mice. (a) Immunoblot analysis of hippocampal (Hc) lysate from C57BL/6N mice 24 h after intranasal NPS treatment. GluR1: t=1.271, df=8, p=0.2396; GluR2: t=0.9666, df=8, p=0.3621; Glt-1: t=1.628, df=8, p=0.1421. (b) Immunoblot analysis of prefrontal cortex (Pfc) lysate from C57BL/6N mice 24 h after intranasal NPS treatment. GluR2: t=0.2798, df=8, p=0.7868; synapsin Ia–b/IIa: t=1.549, df=6, p=0.1601. (c) Immunoblot analysis of Hc lysate from HAB mice 24 h after intranasal NPS treatment. GluR1: t=0.2502, df=9, p=0.8081; GluR2: t=0.1124, df=10, p=0.9127; Glt-1: t=1.582, df=10, p=0.1447; synapsin Ia–b/IIa: t=1.197, df=9, p=0.2619. (d) Immunoblot analysis of Pfc lysate from HAB mice 24 h after intranasal NPS treatment. Glt-1: t=0.8817, df=9, p=0.4009; synapsin Ia–b/IIa: t=0.9739, df=10, p=0.3531. Internal expression control: GAPDH (35 kDa in immunoblot excerpts). The blot excerpts show three representative adjacent bands of each group. The immunoblot data represent cumulated data from at least three independent experiments. C57BL/6N: n=5 for each group. HAB: n=5 for each group. Statistical analysis: Two-tailed unpaired t-test. tp<0.1, *p<0.05, **p<0.01. All data are shown as mean±SEM.

Similar articles

Cited by

References

    1. Bailey KR, Pavlova MN, Rohde AD, Hohmann JG, Crawley JN. Galanin receptor subtype 2 (GalR2) null mutant mice display an anxiogenic-like phenotype specific to the elevated plus-maze. Pharmacol Biochem Behav. 2007;86:8–20. - PMC - PubMed
    1. Blanco E, Bilbao A, Luque-Rojas MJ, Palomino A, Bermúdez-Silva FJ, Suárez J, et al. 2011Attenuation of cocaine-induced conditioned locomotion is associated with altered expression of hippocampal glutamate receptors in mice lacking LPA1 receptors Psychopharmacologye-pub ahead of print 2 September 2011. - PubMed
    1. Born J, Lange T, Kern W, McGregor GP, Bickel U, Fehm HL. Sniffing neuropeptides: a transnasal approach to the human brain. Nat Neurosci. 2002;5:514–516. - PubMed
    1. Bunck M, Czibere L, Horvath C, Graf C, Frank E, Kessler MS, et al. A hypomorphic vasopressin allele prevents anxiety-related behavior. PLoS ONE. 2009;4:e5129. - PMC - PubMed
    1. Bunnett NW, Dazin PF, Payan DG, Grady EF. Characterization of receptors using cyanine 3-labeled neuropeptides. Peptides. 1995;16:733–740. - PubMed

Publication types

MeSH terms