Comparative Study
. 2012 Apr;86(7):3757-66.
doi: 10.1128/JVI.06900-11. Epub 2012 Jan 25.

Distinct transformation tropism exhibited by human T lymphotropic virus type 1 (HTLV-1) and HTLV-2 is the result of postinfection T cell clonal expansion

Affiliations
Comparative Study

Distinct transformation tropism exhibited by human T lymphotropic virus type 1 (HTLV-1) and HTLV-2 is the result of postinfection T cell clonal expansion

Priya Kannian et al. J Virol. 2012 Apr.

Abstract

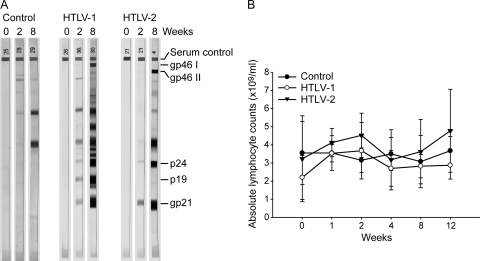
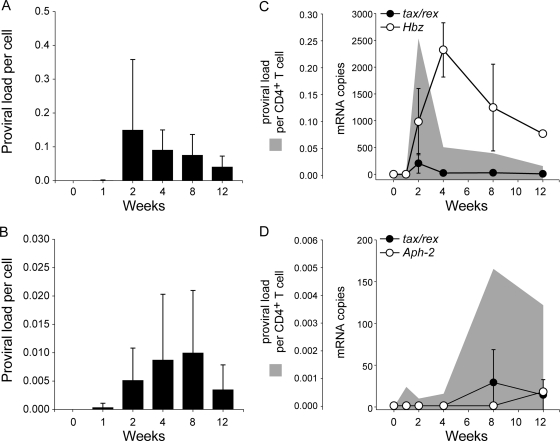
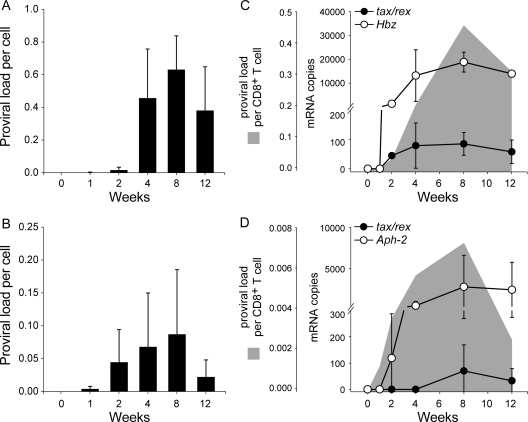
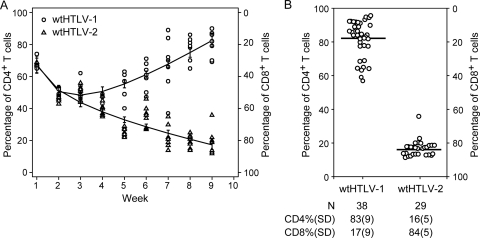
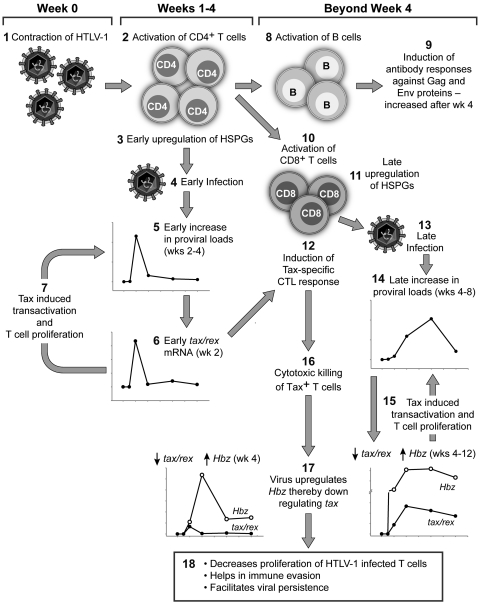
Human T lymphotropic virus type 1 (HTLV-1) and HTLV-2 are related but pathogenically distinct viruses. HTLV-1 mainly causes adult T cell leukemia, while HTLV-2 is not associated with leukemia. In vitro, HTLV-1 and HTLV-2 predominantly transform CD4(+) and CD8(+) T cells, respectively: the genetic determinant maps to the viral envelope. Herein, we investigate whether this transformation tropism occurs during initial infection or subsequently during the cellular transformation process. Since most individuals are chronically infected at the time of detection, we utilized an established rabbit model to longitudinally measure the early HTLV-1 and HTLV-2 infection and replication kinetics in purified CD4(+) and CD8(+) T cells. HTLV-1 and HTLV-2 were detected in both CD4(+) and CD8(+) T cells within 1 week postinoculation. In HTLV-1-infected rabbit CD4(+) T cells, proviral burden and tax/rex mRNA expression peaked early, and expression levels were directly proportional to each other. The late expression of the antisense transcript (Hbz or Aph-2) correlated directly with a late proviral burden peak in HTLV-1- or HTLV-2-infected rabbit CD8(+) T cells, respectively. This study provides the first in vivo evidence that these viruses do not exhibit cellular preference during initial infection. We further evaluated the transformation tropism of HTLV-1 and HTLV-2 over a 9-week period using in vitro cell growth/immortalization assays. At the early weeks, both HTLV-1 and HTLV-2 showed proportionate growth of CD4(+) and CD8(+) T cells. However, beyond week 5, the predominance of one particular T cell type emerged, supporting the conclusion that transformation tropism is a postinfection event due to selective clonal expansion over time.


Figures

Fig 1
Fig 1
Establishment of persistent infection in rabbits. (A) The line blot assay results from one representative rabbit in each of the three groups are shown at weeks 0, 2, and 8. The topmost band is an IgG serum control band. The HTLV-1/2 Gag proteins are represented by p24 and p19 bands. The HTLV-1 envelope surface protein is represented by the gp46 I band. The HTLV-2 envelope surface protein is represented by the gp46 II band. The gp21 band represents the transmembrane component of the HTLV-1/2 envelope. (B) Shown is the average of the absolute lymphocyte counts with the standard deviations among the four rabbits in each of the three groups at the tested time points. The closed circles are the control rabbits, the open circles are the HTLV-1-infected rabbits, and the inverted triangles are the HTLV-2-infected rabbits.
Fig 2
Fig 2
HTLV-1 and HTLV-2 infection in the CD4+ T cells. (A) Average HTLV-1 proviral burden per cell from the four rabbits plotted against the tested time points in weeks. The error bars depict the standard deviations for each bar. (B) Average HTLV-2 proviral burden per cell from the four rabbits plotted against the tested time points in weeks. The error bars depict the standard deviations for each bar. (C) Average expression levels of tax/rex (closed circles) and Hbz (open circles) mRNA in 2/4 HTLV-1-infected rabbits are shown as line plots superimposed over the average proviral loads (gray area plots) from the corresponding rabbits. The error bars depict the standard deviations for each symbol on the line plots. (D) The average expression levels of tax/rex (closed circles) and Aph-2 (open circles) mRNA in 2/4 HTLV-2-infected rabbits are shown as line plots superimposed over the average proviral loads (gray area plots) from the corresponding rabbits. The error bars depict the standard deviations for each symbol on the line plots. For better visualization of the trend, the graphs have been plotted at various scales.
Fig 3
Fig 3
HTLV-1 and HTLV-2 infection in the CD8+ T cells. (A) The average HTLV-1 proviral burden per cell from the four rabbits plotted against the tested time points in weeks. The error bars depict the standard deviations for each bar. (B) The average HTLV-2 proviral burden per cell from the four rabbits plotted against the tested time points in weeks. The error bars depict the standard deviations for each bar. (C) The average expression levels of tax/rex (closed circles) and Hbz (open circles) mRNA in 2/4 HTLV-1-infected rabbits are shown as line plots superimposed over the average proviral loads (gray area plots) from the corresponding rabbits. The error bars depict the standard deviations for each symbol on the line plots. (D) The average expression levels of tax/rex (closed circles) and Aph-2 (open circles) mRNA in 2/4 HTLV-2-infected rabbits are shown as line plots superimposed over the average proviral loads (gray area plots) from the corresponding rabbits. The error bars depict the standard deviations for each symbol on the line plots. For better visualization of the trend, the graphs have been plotted at various scales.
Fig 4
Fig 4
HTLV-1- and HTLV-2-induced immortalization of CD4+ and CD8+ T cells. Gamma-irradiated 729Achneo cells (wtHTLV-1) and 729pH6neo cells (wtHTLV-2) were cocultured with freshly isolated uninfected PBMCs for 9 weeks. The cultures were harvested, stained with anti-CD3, anti-CD4, and anti-CD8 antibodies, and analyzed by flow cytometry once every week. The percentages of CD4+ and CD8+ T cells within the CD3+ T cell gate were determined and normalized to 100. The normalized CD4+ T cells in the individual wells for both the viruses are plotted. Each well is represented by the corresponding symbol, for which the left y axis shows the percentage of CD4+ T cells and the right y axis shows the percentage of CD8+ T cells. (A) Longitudinal analysis of the T cell phenotype of wtHTLV-1- or wtHTLV-2-induced immortalization. Eight wells were analyzed at each time point for both viruses. The circles represent wtHTLV-1, and the triangles represent wtHTLV-2. The vertical bar represents the 95% confidence interval for each of the viruses at the given time points. The trend lines connect the estimated mean values in each of the two groups, which is an adjusted mean value from a generalized linear model. The differences in the mean values between wtHTLV-1 and wtHTLV-2 were statistically significant from week 4 onwards (week 4, P = 0.04; weeks 5 to 9, P < 0.001; generalized linear model with Tukey's method for multiplicity adjustment). (B) T cell phenotypic analysis of wtHTLV-1- or wtHTLV-2-induced immortalization after 9 weeks of coculture (remaining wells from data above). The bar represents the average percentage of T cells. The total number of wells analyzed and the average percentages (standard deviations [SD]) for both CD4+ and CD8+ T cells are indicated below. The percentage of wtHTLV-1-immortalized CD4+ T cells was significantly higher than that of the wtHTLV-2-immortalized CD4+ T cells (P < 0.001, t test).
Fig 5
Fig 5
Sequential early events after HTLV-1 infection in an immunocompetent host. This model schematically depicts the early events in a HTLV-1-infected host. The Arabic numerals represent the sequential events in the model. (Event 1) Infection of the host with HTLV-1. (Event 2) Initial activation of helper CD4+ T cells by HTLV-1. (Event 3) Activation increases HSPG expression on the surface of the CD4+ T cells. (Event 4) The abundance of HSPGs on the surface increases HTLV-1 binding and entry into these activated HTLV-1-specific CD4+ T cells. (Event 5) Infection results in an early increase in proviral load in these cells by weeks 2 to 4. (Event 6) Increased proviral load is reflected in early tax/rex mRNA expression, by week 2. (Event 7) Tax-induced viral transactivation and low-grade T cell proliferation also feed back into increasing the proviral loads. (Event 8) The activated HTLV-1-specific CD4+ T cells activate B cells to induce antibody responses against Gag and Env proteins by week 4 (event 9) and activate CD8+ T cells to induce cytotoxic killing of HTLV-1-infected cells (event 10). (Event 11) Activation of CD8+ T cells leads to an increase of HSPG expression on their surface. (Event 12) Activation with simultaneously high levels of Tax induces Tax-specific CTL responses by week 4. (Event 13) HTLV-1 takes advantage of the late availability of HSPGs on the CD8+ T cells. (Event 14) This results in a late proviral load peak by weeks 4 to 8. (Event 15) Fresh infection induces tax/rex mRNA expression, which in turn increases proviral loads by viral transactivation and low-grade T cell proliferation. (Event 16) Increased Tax expression induces cytotoxic killing of Tax+ T cells. (Event 17) After week 4, the virus also alters its gene expression profile by reducing tax/rex mRNA and increasing Hbz mRNA expression. (Event 18) These sequential events result in decreased proliferation of HTLV-1-infected T cells, immune evasion, and long-term viral persistence.

References

    1. Araujo A, Hall WW. 2004. Human T-lymphotropic virus type II and neurological disease. Ann. Neurol. 56:10–19 - PubMed
    1. Arnold J, et al. 2006. Enhancement of infectivity and persistence in vivo by HBZ, a natural antisense coded protein of HTLV-1. Blood 107:3976–3982 - PMC - PubMed
    1. Bartman MT, et al. 2008. Long-term increases in lymphocytes and platelets in human T-lymphotropic virus type II infection. Blood 112:3995–4002 - PMC - PubMed
    1. Bartoe JT, et al. 2000. Functional role of pX open reading frame II of human T-lymphotropic virus type 1 in maintenance of viral loads in vivo. J. Virol. 74:1094–1100 - PMC - PubMed
    1. Cockerell GL, Rovank J, Green PL, Chen ISY. 1996. A deletion in the proximal untranslated pX region of human T-cell leukemia virus type II decreases viral replication but not infectivity in vivo. Blood 87:1030–1035 - PubMed

Publication types

MeSH terms

Substances