Comparative Study
. 2012 Mar;11(3):M111.014050.
doi: 10.1074/mcp.M111.014050. Epub 2012 Jan 25.

Comparative proteomic analysis of eleven common cell lines reveals ubiquitous but varying expression of most proteins

Affiliations
Comparative Study

Comparative proteomic analysis of eleven common cell lines reveals ubiquitous but varying expression of most proteins

Tamar Geiger et al. Mol Cell Proteomics. 2012 Mar.

Abstract

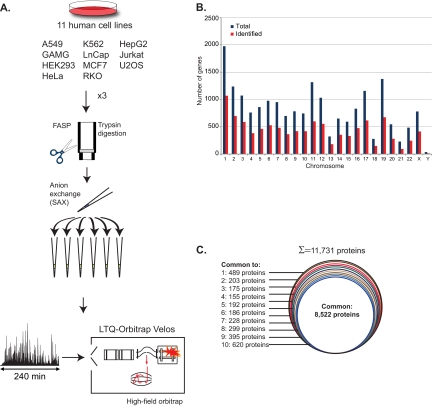
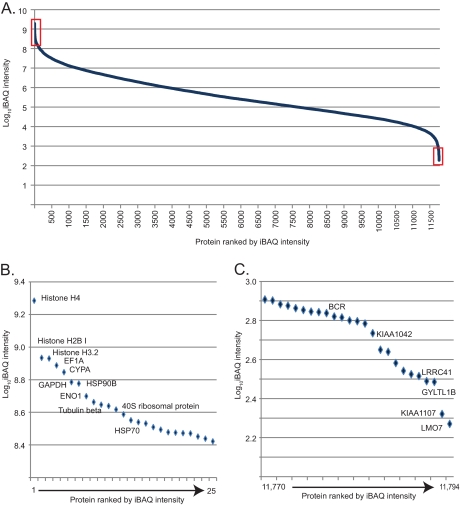
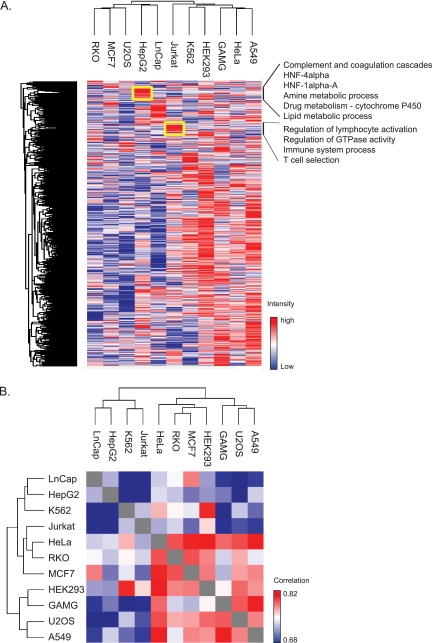
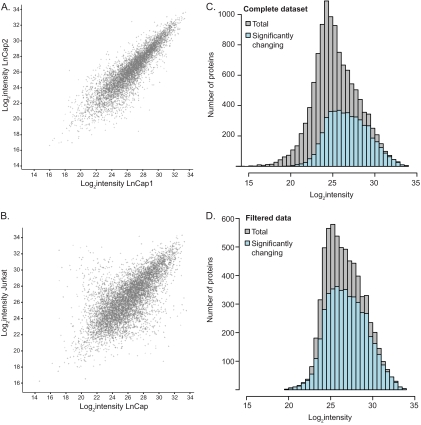
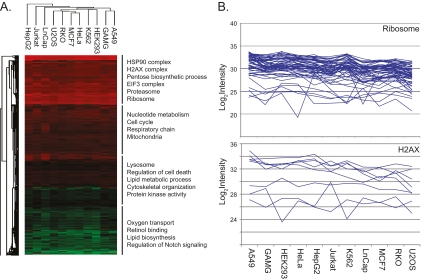
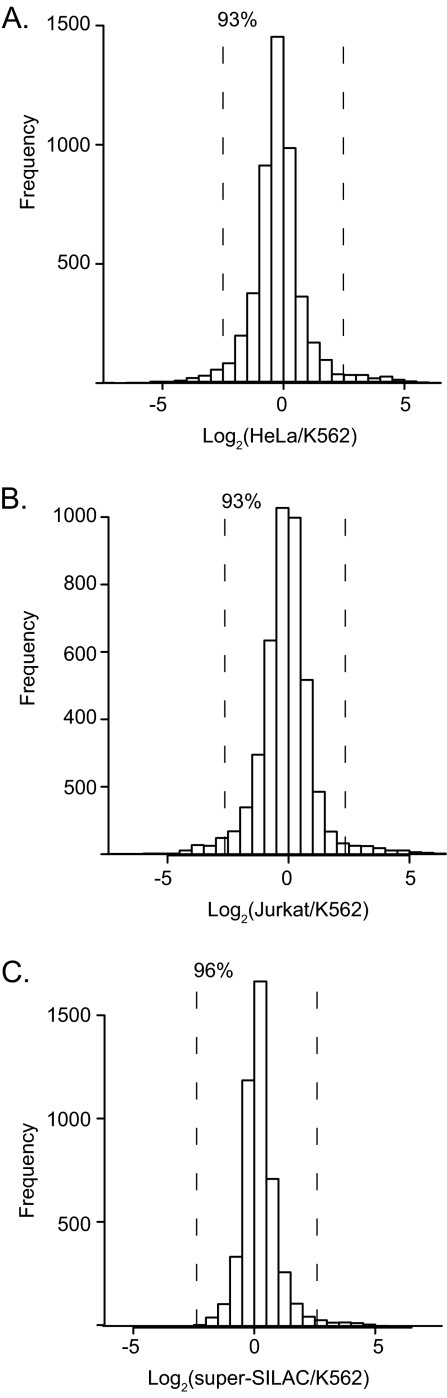
Deep proteomic analysis of mammalian cell lines would yield an inventory of the building blocks of the most commonly used systems in biological research. Mass spectrometry-based proteomics can identify and quantify proteins in a global and unbiased manner and can highlight the cellular processes that are altered between such systems. We analyzed 11 human cell lines using an LTQ-Orbitrap family mass spectrometer with a "high field" Orbitrap mass analyzer with improved resolution and sequencing speed. We identified a total of 11,731 proteins, and on average 10,361 ± 120 proteins in each cell line. This very high proteome coverage enabled analysis of a broad range of processes and functions. Despite the distinct origins of the cell lines, our quantitative results showed surprisingly high similarity in terms of expressed proteins. Nevertheless, this global similarity of the proteomes did not imply equal expression levels of individual proteins across the 11 cell lines, as we found significant differences in expression levels for an estimated two-third of them. The variability in cellular expression levels was similar for low and high abundance proteins, and even many of the most highly expressed proteins with household roles showed significant differences between cells. Metabolic pathways, which have high redundancy, exhibited variable expression, whereas basic cellular functions such as the basal transcription machinery varied much less. We harness knowledge of these cell line proteomes for the construction of a broad coverage "super-SILAC" quantification standard. Together with the accompanying paper (Schaab, C. MCP 2012, PMID: 22301388) (17) these data can be used to obtain reference expression profiles for proteins of interest both within and across cell line proteomes.


Figures

Fig. 1.
Fig. 1.
Deep proteome analysis of eleven cell lines. A, Eleven commonly used human cell lines were cultured, lysed in SDS based buffer, trypsin digested according to the FASP protocol, and separated into six fractions using SAX in a StageTip format. The analysis was performed in triplicate (1-day measurement per proteome each). LC MS/MS with 4-h runs and HCD fragmentation were performed in the LTQ-Orbitrap Velos equipped with a high field Orbitrap analyzer. B, Distribution of the identified genes (red) in relation to total genes (blue) for each chromosome. Slightly more than half the genome was covered in total and in each chromosome. C, Proportion of proteins identified in all or various subsets of cell lines.
Fig. 2.
Fig. 2.
Dynamic range of the composite cell line proteome. A, The median absolute expression value of each protein in the eleven cell lines was estimated by iBAQ revealing the typical S-shaped distribution over the seven orders of dynamic range of MS signals. B, The 25 most abundant proteins (left red box in A) are structural constituents of chromatin or the cytoskeleton or they are abundant enzymes, chaperones, and constituents of the translational apparatus. C, The 25 proteins with the lowest abundance (right red box in A) include uncharacterized proteins and isoforms of proteins. Note that in-silico estimation of protein amount is not accurate in this abundance range.
Fig. 3.
Fig. 3.
Hierarchical clustering based on label-free proteome quantification. A, Two-way unsupervised hierarchical clustering of the median protein expression values of all proteins in a cell line does not group the cell lines according to the tissue of origin. This indicates dedifferentiation compared with the in vivo cell type. However, clusters of coregulated proteins carrying out cell type specific functions are retained (see yellow boxes for examples). Listed functions have FDR values (greatly) below 0.02 by Fishers exact test. B, Matrix representation of Pearson correlation values of the label-free protein abundances of each cell line proteome against the others. Correlations are uniformly high, varying only between r = 0.68 and 0.83.
Fig. 4.
Fig. 4.
Significance of proteomic changes across the abundance range. A, Scatter plot of label-free protein intensities between the first and second replicate of the prostate cancer cell line LnCap. B, The spread in the scatter plot of the median of triplicates of two different cell lines LnCap and the T-cell leukemia derived Jurkat cells is larger than in A. C, Significantly changing proteins in at least one of the eleven cell lines appear to be more abundant compared with the entire proteome. D, Filtering for robustly quantified proteins (a minimum of 16 valid quantification values) reveals that more than two thirds of the proteome are changing significantly and that this proportion does not depend on protein abundance.
Fig. 5.
Fig. 5.
Variability of cellular functions in dependence of protein abundance. A, Annotation matrix of protein attributes, such as pathways, complexes and gene ontologies versus the eleven cell lines. Color code indicates the normalized median abundance of the proteins belonging to the category (red most abundant; green least abundant). Protein annotations are separated into four blocks and labeled with representative individual annotations. B, Proteins comprising the “ribosomal” category are highly and uniformly expressed across the cell lines (upper panel). Proteins comprising the category “H2AX” are highly abundant but their expression levels vary dramatically across the cell lines.
Fig. 6.
Fig. 6.
Use of cell lines as a spike-in SILAC standard. Knowledge of the overall similarities of the proteomes was used to construct a five cell line, heavy labeled “super-SILAC” reference standard. A, HeLa and K562 as well as Jurkat and K562 (B) proteins are sufficiently similar that most of the SILAC ratios are within a fivefold ratio above and below the one to one ratio. C, Quantification of the heavy super-SILAC mix consisting of five cell lines quantifies 96% of the K562 proteome within a fivefold ratio.

Similar articles

Cited by

References

    1. Burkard T. R., Planyavsky M., Kaupe I., Breitwieser F. P., Bürckstummer T., Bennett K. L., Superti-Furga G., Colinge J. (2011) Initial characterization of the human central proteome. BMC Syst. Biol. 5, 17. - PMC - PubMed
    1. Lundberg E., Fagerberg L., Klevebring D., Matic I., Geiger T., Cox J., Algenäs C., Lundeberg J., Mann M., Uhlen M. (2010) Defining the transcriptome and proteome in three functionally different human cell lines. Mol. Syst. Biol. 6, 450. - PMC - PubMed
    1. Domon B., Aebersold R. (2006) Mass spectrometry and protein analysis. Science 312, 212–217 - PubMed
    1. Swaney D. L., Wenger C. D., Coon J. J. (2010) Value of using multiple proteases for large-scale mass spectrometry-based proteomics. J. Proteome Res. 9, 1323–1329 - PMC - PubMed
    1. Mallick P., Kuster B. (2010) Proteomics: a pragmatic perspective. Nat. Biotechnol. 28, 695–709 - PubMed

Publication types