

Loss of genomic imprinting in mouse embryos with fast rates of preimplantation development in culture
- PMID: 22278980
- PMCID: PMC4480067
- DOI: 10.1095/biolreprod.111.096602
Loss of genomic imprinting in mouse embryos with fast rates of preimplantation development in culture
Abstract
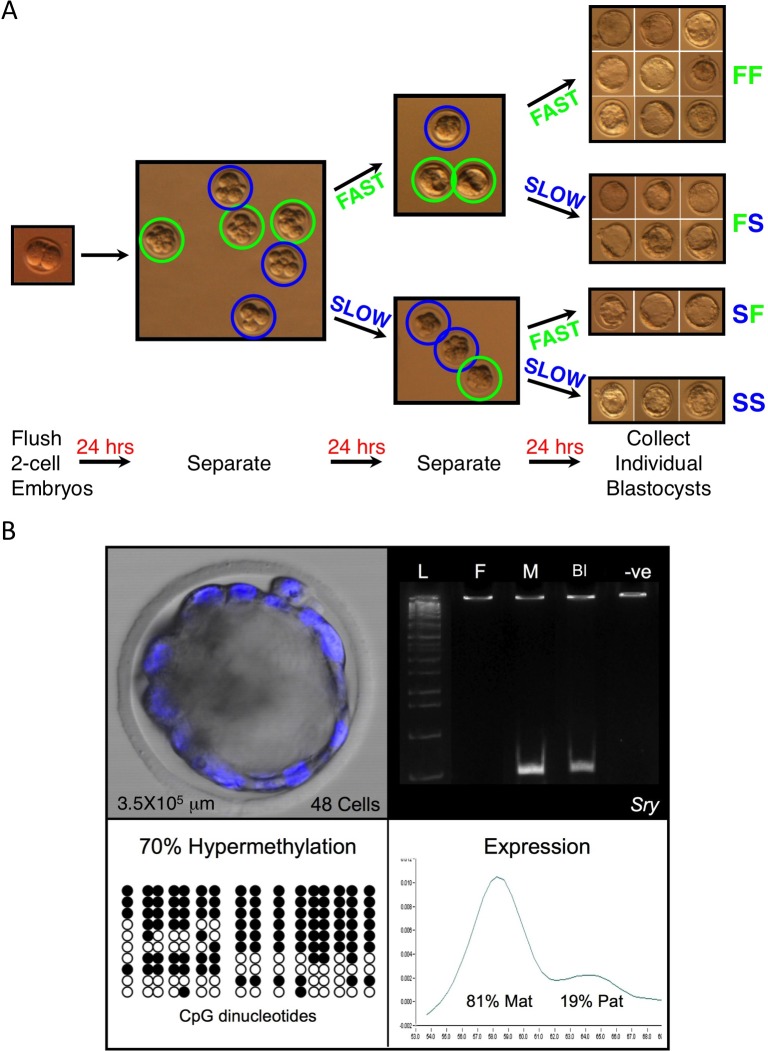
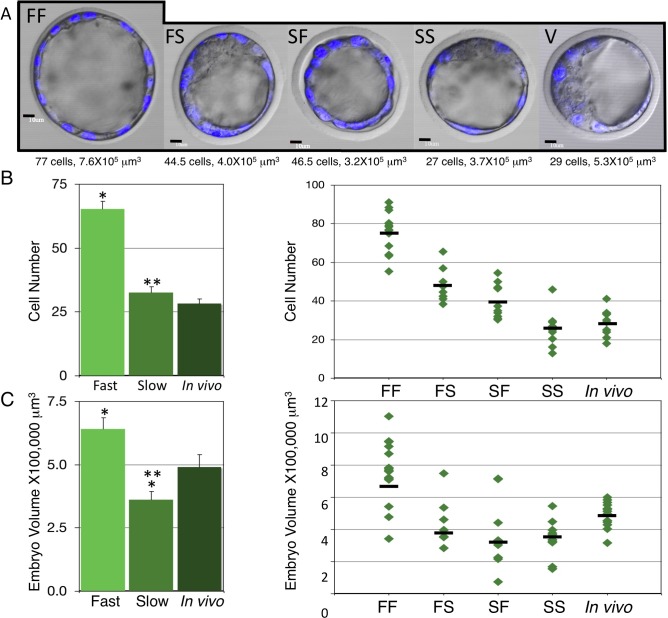
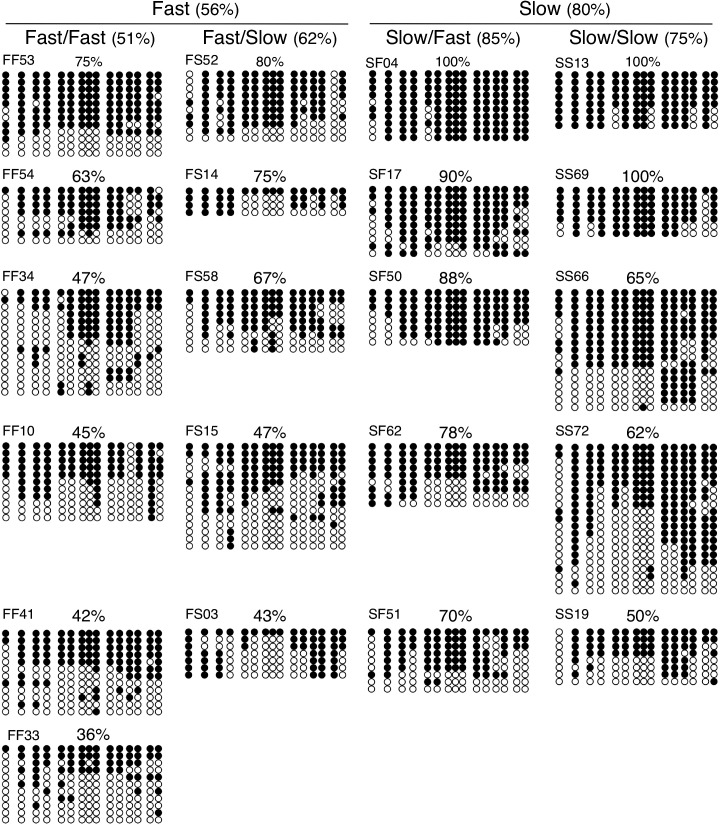
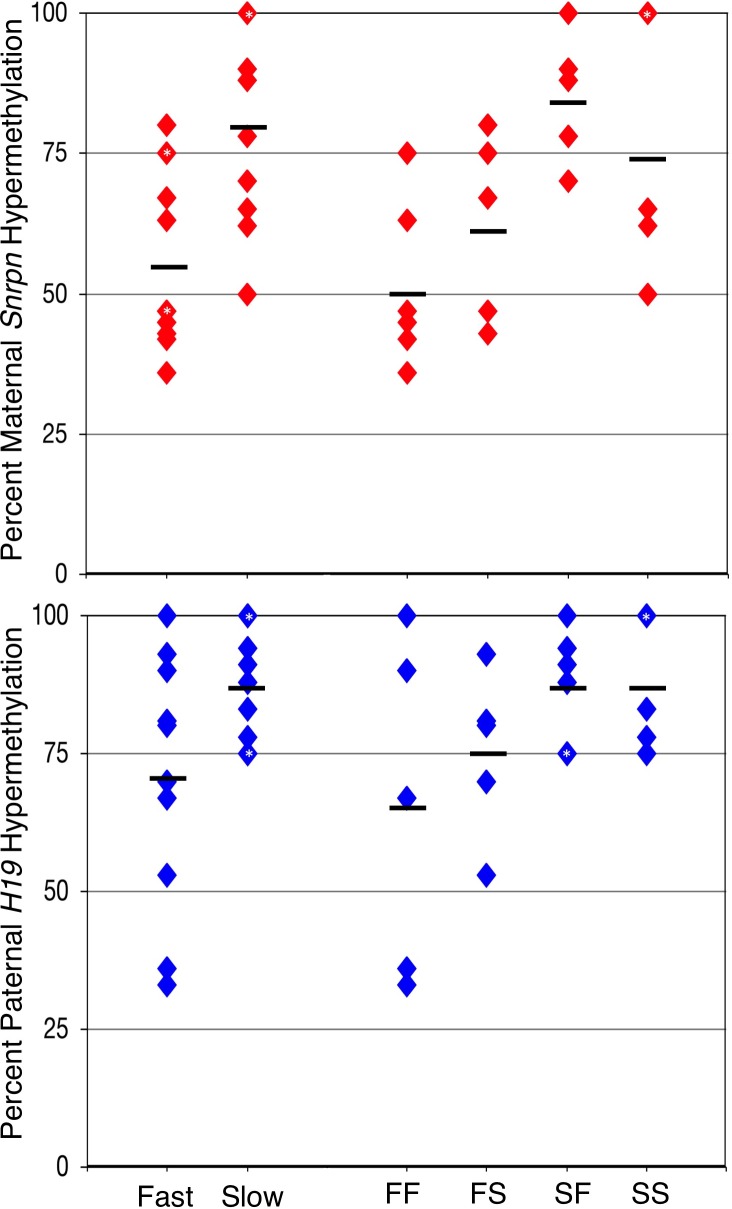
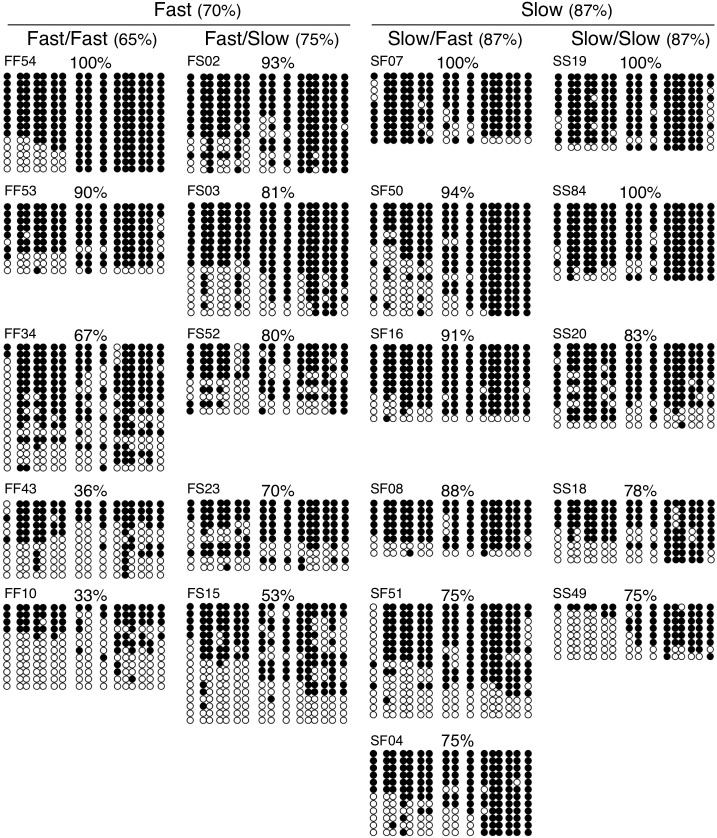
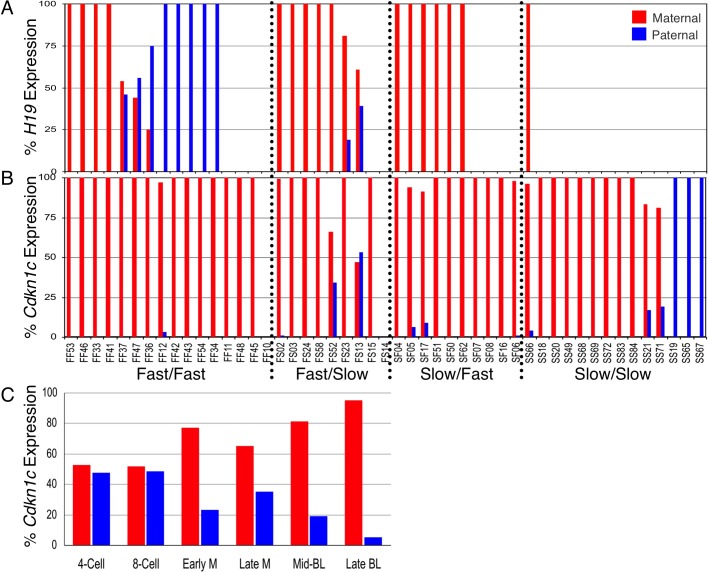
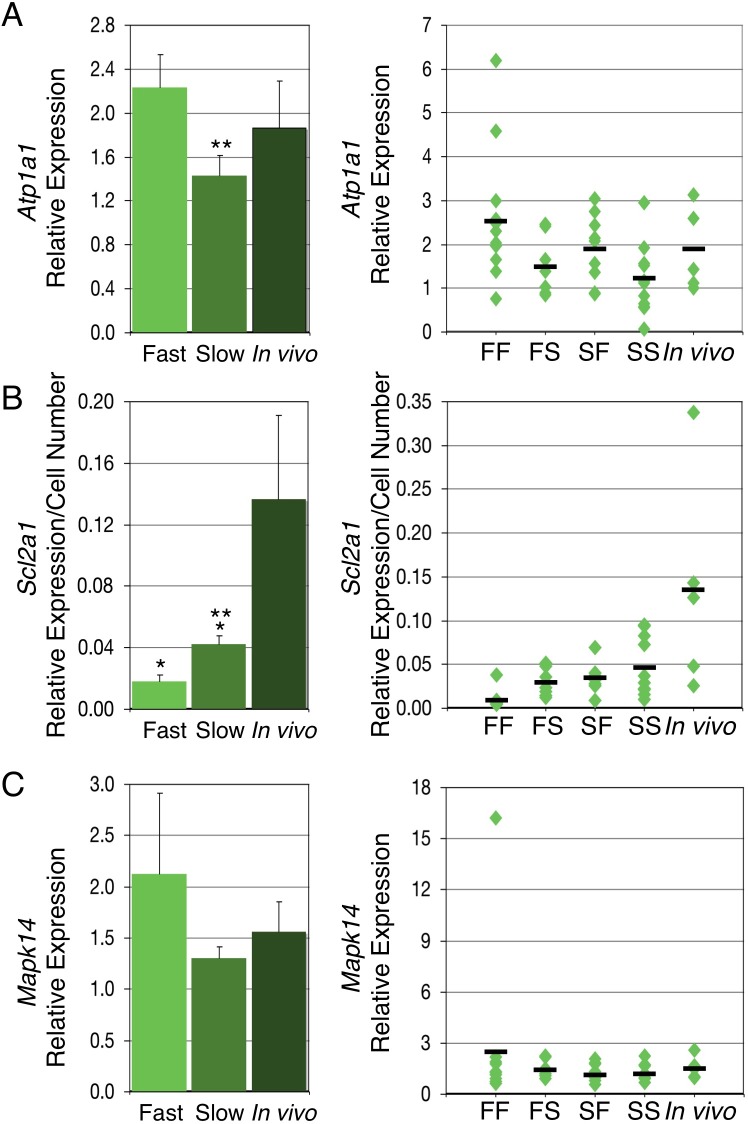
Currently, the stage of embryo development has been proposed as one of many criteria for identifying healthy embryos in infertility clinics with the fastest embryos being highlighted as the healthiest. However the validity of this as an accurate criterion with respect to genomic imprinting is unknown. Given that embryo development in culture generally requires an extra day compared to in vivo development, we hypothesized that loss of imprinting correlates with slower rates of embryonic development. To evaluate this, embryos were recovered at the 2-cell stage, separated into four groups based on morphological stage at two predetermined time points, and cultured to blastocysts. We examined cell number, embryo volume, embryo sex, imprinted Snrpn and H19 methylation, imprinted Snrpn, H19, and Cdkn1c expression, and expression of genes involved in embryo metabolism-Atp1a1, Slc2a1, and Mapk14-all within the same individual embryo. Contrary to our hypothesis, we observed that faster developing embryos exhibited greater cell numbers and embryo volumes as well as greater perturbations in genomic imprinting and metabolic marker expression. Embryos with slower rates of preimplantation development were most similar to in vivo derived embryos, displaying similar cell numbers, embryo volumes, Snrpn and H19 imprinted methylation, H19 imprinted expression, and Atp1a1 and Slc2a1 expression. We conclude that faster development rates in vitro are correlated with loss of genomic imprinting and aberrant metabolic marker expression. Importantly, we identified a subset of in vitro cultured embryos that, according to the parameters evaluated, are very similar to in vivo derived embryos and thus are likely most suitable for embryo transfer.
Figures
Comment in
-
Growing fast or slow: what makes the best embryo?Biol Reprod. 2012 May 10;86(5):142, 1-2. doi: 10.1095/biolreprod.112.100289. Print 2012 May. Biol Reprod. 2012. PMID: 22402966 No abstract available.
Similar articles
-
Manipulations of mouse embryos prior to implantation result in aberrant expression of imprinted genes on day 9.5 of development.Hum Mol Genet. 2008 Jan 1;17(1):1-14. doi: 10.1093/hmg/ddm280. Epub 2007 Sep 27. Hum Mol Genet. 2008. PMID: 17901045
-
The loss of imprinted DNA methylation in mouse blastocysts is inflicted to a similar extent by in vitro follicle culture and ovulation induction.Mol Hum Reprod. 2016 Jun;22(6):427-41. doi: 10.1093/molehr/gaw013. Epub 2016 Feb 7. Mol Hum Reprod. 2016. PMID: 26908643
-
Side-by-side comparison of five commercial media systems in a mouse model: suboptimal in vitro culture interferes with imprint maintenance.Biol Reprod. 2010 Dec;83(6):938-50. doi: 10.1095/biolreprod.110.085480. Epub 2010 Aug 11. Biol Reprod. 2010. PMID: 20702853
-
Genomic imprinting in primate embryos and embryonic stem cells.Reprod Fertil Dev. 2006;18(8):817-21. doi: 10.1071/rd06112. Reprod Fertil Dev. 2006. PMID: 17147929 Review.
-
Expression of imprinted genes in human preimplantation development.Mol Cell Endocrinol. 2001 Oct 22;183 Suppl 1:S35-40. doi: 10.1016/s0303-7207(01)00575-5. Mol Cell Endocrinol. 2001. PMID: 11576730 Review.
Cited by
-
Expression and potential roles of HLA-G in human spermatogenesis and early embryonic development.PLoS One. 2014 Mar 25;9(3):e92889. doi: 10.1371/journal.pone.0092889. eCollection 2014. PLoS One. 2014. PMID: 24667226 Free PMC article. Clinical Trial.
-
From Embryos to Adults: A DOHaD Perspective on In Vitro Fertilization and Other Assisted Reproductive Technologies.Healthcare (Basel). 2016 Aug 9;4(3):51. doi: 10.3390/healthcare4030051. Healthcare (Basel). 2016. PMID: 27517965 Free PMC article.
-
Association of medically assisted reproduction with offspring cord blood DNA methylation across cohorts.Hum Reprod. 2021 Jul 19;36(8):2403-2413. doi: 10.1093/humrep/deab137. Hum Reprod. 2021. PMID: 34136910 Free PMC article.
-
Sodium butyrate interrupts the maturation of oocytes and enhances the development of preimplantation embryos.PLoS One. 2019 Jul 29;14(7):e0220479. doi: 10.1371/journal.pone.0220479. eCollection 2019. PLoS One. 2019. PMID: 31356635 Free PMC article.
-
MicroRNAomic Analysis of Spent Media from Slow- and Fast-Growing Bovine Embryos Reveal Distinct Differences.Animals (Basel). 2024 Aug 13;14(16):2331. doi: 10.3390/ani14162331. Animals (Basel). 2024. PMID: 39199865 Free PMC article.
References
-
- Bowman P, McLaren A. Viability and growth of mouse embryos after in vitro culture and fusion. J Embryol Exp Morphol 1970; 23: 693 704. - PubMed
-
- Harlow GM, Quinn P. Development of preimplantation mouse embryos in vivo and in vitro. Aust J Biol Sci 1982; 35: 187 193. - PubMed
-
- Biggers JD, Summers MC. Choosing a culture medium: making informed choices. Fertil Steril 2008; 90: 473 483. - PubMed
-
- Gardner DK. Dissection of culture media for embryos: the most important and less important components and characteristics. Reprod Fertil Dev 2008; 20: 9 18. - PubMed
-
- Sasaki H, Ferguson-Smith AC, Shum AS, Barton SC, Surani MA. Temporal and spatial regulation of H19 imprinting in normal and uniparental mouse embryos. Development 1995; 121: 4195 4202. - PubMed
Publication types
MeSH terms
Substances
Grants and funding
LinkOut - more resources
Full Text Sources
Miscellaneous
