. 2012 Jan 15;26(2):163-75.
doi: 10.1101/gad.179721.111.

R-loop-mediated genome instability in mRNA cleavage and polyadenylation mutants

Affiliations

R-loop-mediated genome instability in mRNA cleavage and polyadenylation mutants

Peter C Stirling et al. Genes Dev. .

Abstract

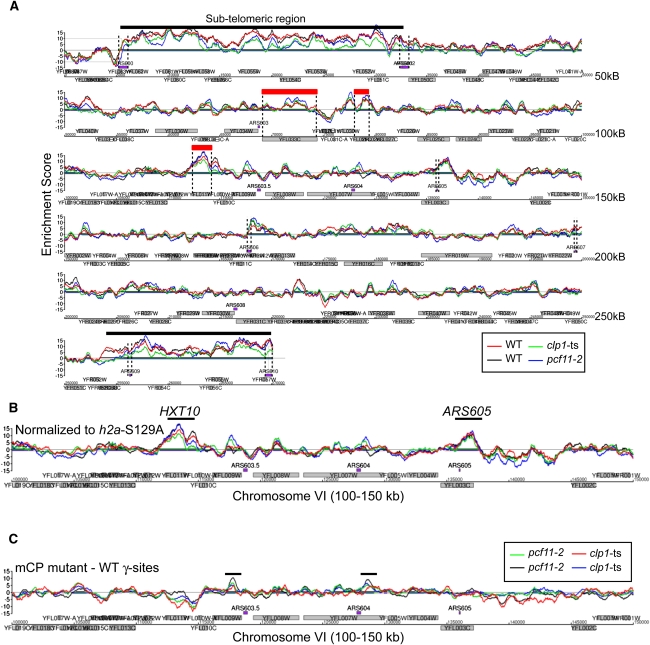
Genome instability via RNA:DNA hybrid-mediated R loops has been observed in mutants involved in various aspects of transcription and RNA processing. The prevalence of this mechanism among essential chromosome instability (CIN) genes remains unclear. In a secondary screen for increased Rad52 foci in CIN mutants, representing ∼25% of essential genes, we identified seven essential subunits of the mRNA cleavage and polyadenylation (mCP) machinery. Genome-wide analysis of fragile sites by chromatin immunoprecipitation (ChIP) and microarray (ChIP-chip) of phosphorylated H2A in these mutants supported a transcription-dependent mechanism of DNA damage characteristic of R loops. In parallel, we directly detected increased RNA:DNA hybrid formation in mCP mutants and demonstrated that CIN is suppressed by expression of the R-loop-degrading enzyme RNaseH. To investigate the conservation of CIN in mCP mutants, we focused on FIP1L1, the human ortholog of yeast FIP1, a conserved mCP component that is part of an oncogenic fusion in eosinophilic leukemia. We found that truncation fusions of yeast FIP1 analogous to those in cancer cause loss of function and that siRNA knockdown of FIP1L1 in human cells increases DNA damage and chromosome breakage. Our findings illuminate how mCP maintains genome integrity by suppressing R-loop formation and suggest that this function may be relevant to certain human cancers.


Figures

Figure 1.
Figure 1.
A screen for DNA damage foci in essential CIN genes. (A) Percentage of cells with Rad52 foci. Bars are color-coded to denote cell cycle arrest as large-budded cells (black), foci formation only in budded cells (dark gray), or foci formation at all stages (light gray). Multimember biological groups are labeled above. (B) Genetic interactions between foci-generating mutants and rad52Δ. Equal ODs of the indicated strains were serially diluted and spotted on YPD ± 5 mM HU at 30°C.
Figure 2.
Figure 2.
High-resolution mapping of yeast γ sites. (A) Overview of γ sites for Chromosome VI (ChrVI), indicating chromosomal features. (Purple box) ARS; (gray box) ORF. For A and B, the colored traces represent duplicates of wild type (red and black) and one replicate each of clp1-ts (green) and pcf11-2 (blue). In A, large subtelomeric γ-site regions are noted with black bars, seven enriched ARS are noted with vertical dotted lines, and three examples of repressed genes (less than one mRNA per hour) are noted with dotted lines connecting to red boxes to define the gene boundaries. For a detailed comparison with published γ sites, see the Supplemental Material. (B) Representative pcf11-2 and clp1-ts γ-site profiles for a 50-kB segment of ChrVI from the third row in A. Enriched γ sites at HXT10, which is repressed in glucose, and ARS605 are indicated. (C) Replicates of pcf11-2 (black, green) and clp1-ts (blue, red) γ-site profiles normalized to wild type to identify regions of enhanced signal common to both mutants. The same 50-kB region of ChrVI from B is shown after normalization to the wild-type γ-site profile. Common differences are marked with a black bar.
Figure 3.
Figure 3.
clp1-ts and pcf11-2 mutant γ sites link DNA damage to transcription. (A) Linkage of mutant-specific peaks to replication origins. (Left panel) Peaks within 2 kb of replication origins were identified in the mutant-WT difference profiles and compared with predicted values generated by Monte Carlo simulation of randomized ARS positions. (*) P < 0.0001. The right panel shows the relative orientation, with respect to ARS, of ORFs encompassed by ARS-linked γ-site differences across three of four mutant replicates (pointed end indicates the direction of transcription). The average transcriptional frequency of ARS-colliding ORFs in γ sites was significantly higher than for all ARS-colliding ORFs across the entire genome (P < 0.05). (B) Transcriptional frequency of ORFs with an enhanced γ-H2A signal in wild-type cells and mCP mutant normalized to wild-type samples. The distribution of transcription frequencies (Holstege et al. 1998) is shown for all ORFs (gray bars), ORFs covered at least 25% by a wild-type γ site (black bars), and ORFs covered at least 10% by a γ-site difference in clp1-ts and pcf11-2 ChIP–chip profiles. (C) Effect of the transcription inhibitor 6-azauracil on Rad52 foci formation in wild-type and mutant strains. Asterisks in B indicate significant deviations from all ORFs within a transcription frequency category (hypergeometric test), and asterisks in C indicate significant differences in Rad52 foci levels; Student's t-test, (*) P < 0.05; (**) P < 0.005.
Figure 4.
Figure 4.
Transcription-coupled R loops are the likely cause of CIN in mCP mutants. (A) Tenfold serial dilution spot assays of mCP mutant strains on indicated medium. ctf4Δ is included as a sensitive control strain. (Right) An additional YPD control is included for cisplatin sensitivity because these plates have a different pH. (B) Plate images of Ctf phenotypes for selected mCP mutants and a control Ctf mutant expressing an empty vector or human RNaseH1. Significantly fewer colonies with red sectors (P < 0.05) are seen when RNaseH1 is expressed in mCP but not control Ctf mutants (see Supplemental Fig. S4). (C) Growth curves of mCP mutants with and without the yeast RNaseH genes RNH1 and RNH201 (rnhΔΔ). (D) Immunofluorescence of RNA:DNA hybrids in chromosome spreads. Representative spreads from wild-type and pcf11-ts10 cells ([blue] DNA; [red] RNA:DNA hybrid) (left panel) and quantification of the immunofluorescence data for the indicated mutants (right panel) are shown. “R-loop-positive controls” indicates strains known or predicted to form R loops, and “Rad52 foci-positive controls” indicates strains that form Rad52 foci (Fig. 1) but are not predicted to form R loops. Significant differences from wild type (P < 0.05) are indicated by an asterisk.
Figure 5.
Figure 5.
Truncation fusion of FIP1 causes genome instability and DNA damage. (A) Tetrad dissection of truncation fusions of FIP1 at two orthologous sites to breakpoints seen in human FIP1L1-PDGFRα-driven eosinophilic leukemia. (Left) The sites of truncation fusion are indicated in the schematic. (Right) Fusion-bearing His+ colonies are circled. (B) Ctf assay of full-length FIP1-GFP and FIP11-279-GFP. (C) Rad52-YFP foci measurements from FIP1 mutant strains. (D) Quantification of RNA:DNA hybrid formation in FIP1 mutant strains.
Figure 6.
Figure 6.
Loss of human FIP1L1 function causes CIN. (A, left panel) Chromatid breaks/fragments in mitotic chromosome spreads from siRNA- or bleomycin-treated cells (bleomycin value is shown on the right axis). The average value of replicate experiments is shown (error bars, SEM; [*] P < 0.05). (Right panel) Western blot of FIP1L1 in siRNA-treated HCT116 cells by single (FIP1L1) or pooled (FIP1L1 and GAPDH control) siRNAs. α-Tubulin was blotted as a loading control. (B) Representative chromosome spread indicating DNA breaks and fragments (white arrowheads in inset) associated with FIP1L1 siRNA. (C) 53BP1-mCherry foci per nucleus in bleomycin and GAPDH or FIP1L1 siRNA-treated cells ([*] mean foci/nucleus is significantly different, P < 0.001). Values from a representative of three data sets are shown. (D) Representative images of 53BP1-mCherry used to generate data in C.

Similar articles

Cited by

References

    1. Alvaro D, Lisby M, Rothstein R 2007. Genome-wide analysis of Rad52 foci reveals diverse mechanisms impacting recombination. PLoS Genet 3: e228 doi: 10.1371/journal.pgen.0030228 - PMC - PubMed
    1. Andersen MP, Nelson ZW, Hetrick ED, Gottschling DE 2008. A genetic screen for increased loss of heterozygosity in Saccharomyces cerevisiae. Genetics 179: 1179–1195 - PMC - PubMed
    1. Barber TD, McManus K, Yuen KW, Reis M, Parmigiani G, Shen D, Barrett I, Nouhi Y, Spencer F, Markowitz S, et al. 2008. Chromatid cohesion defects may underlie chromosome instability in human colorectal cancers. Proc Natl Acad Sci 105: 3443–3448 - PMC - PubMed
    1. Bell DW, Sikdar N, Lee KY, Price JC, Chatterjee R, Park HD, Fox J, Ishiai M, Rudd ML, Pollock LM, et al. 2011. Predisposition to cancer caused by genetic and functional defects of Mammalian atad5. PLoS Genet 7: e1002245 doi: 10.1371/journal.pgen.1002245 - PMC - PubMed
    1. Birse CE, Minvielle-Sebastia L, Lee BA, Keller W, Proudfoot NJ 1998. Coupling termination of transcription to messenger RNA maturation in yeast. Science 280: 298–301 - PubMed

Publication types

MeSH terms

Substances