. 2012 Mar 1;188(5):2316-27.
doi: 10.4049/jimmunol.1102683. Epub 2012 Jan 25.

Glutathione reductase facilitates host defense by sustaining phagocytic oxidative burst and promoting the development of neutrophil extracellular traps

Affiliations

Glutathione reductase facilitates host defense by sustaining phagocytic oxidative burst and promoting the development of neutrophil extracellular traps

Jing Yan et al. J Immunol. .

Abstract

Glutathione reductase (Gsr) catalyzes the reduction of glutathione disulfide to glutathione, which plays an important role in the bactericidal function of phagocytes. Because Gsr has been implicated in the oxidative burst in human neutrophils and is abundantly expressed in the lymphoid system, we hypothesized that Gsr-deficient mice would exhibit marked defects during the immune response against bacterial challenge. We report in this study that Gsr-null mice exhibited enhanced susceptibility to Escherichia coli challenge, indicated by dramatically increased bacterial burden, cytokine storm, striking histological abnormalities, and substantially elevated mortality. Additionally, Gsr-null mice exhibited elevated sensitivity to Staphylococcus aureus. Examination of the bactericidal functions of the neutrophils from Gsr-deficient mice in vitro revealed impaired phagocytosis and defective bacterial killing activities. Although Gsr catalyzes the regeneration of glutathione, a major cellular antioxidant, Gsr-deficient neutrophils paradoxically produced far less reactive oxygen species upon activation both ex vivo and in vivo. Unlike wild-type neutrophils that exhibited a sustained oxidative burst upon stimulation with phorbol ester and fMLP, Gsr-deficient neutrophils displayed a very transient oxidative burst that abruptly ceased shortly after stimulation. Likewise, Gsr-deficient neutrophils also exhibited an attenuated oxidative burst upon encountering E. coli. Biochemical analysis revealed that the hexose monophosphate shunt was compromised in Gsr-deficient neutrophils. Moreover, Gsr-deficient neutrophils displayed a marked impairment in the formation of neutrophil extracellular traps, a bactericidal mechanism that operates after neutrophil death. Thus, Gsr-mediated redox regulation is crucial for bacterial clearance during host defense against massive bacterial challenge.


Figures

Figure 1
Figure 1
Gsr-deficient mice exhibit impaired bactericidal activity and increased susceptibility to E. coli challenge. A. Survival curves of wildtype and Gsr-null mice after E. coli challenge. E. coli (O55:B5) were introduced either i.p. (left panel) or i.v. (right panel). For i.p. infection, mice (n=12 for wildtype; n=11 for Gsr-null) were challenged with E. coli at a dose of 8.3 ×10⁶ CFU/g b.w. For i.v. infection, mice (n=15 for both strains) were challenged with E. coli at a dose of 2.5 ×10⁷ CFU/g b.w. B. Bacterial burden in the blood and spleens after E. coli challenge. Mice were infected i.v. with E. coli (O55:B5) at a dose of 2.5 × 10⁷ CFU/g b.w., and euthanized 24 h later. Blood and spleens were excised aseptically. Blood and spleen homogenates were cultured on LB agar plates. Colony numbers were normalized to blood volume or spleen weight. Bars represent the median values. *, p < 0.05, comparing between genotypes (Wilcoxon’s signed rank test). C. Bacterial load detected by in vivo bioluminescent imaging. Mice were infected i.p. with bioluminescent E. coli Xen-14 cells (8.3×10⁶ CFU/g b.w). After 24 h, bioluminescent E. coli were visualized using IVIS Spectrum imaging system (exposure time, 1 min; FOV, D; binning, 8). Results shown are representative images from 3 experiments.
Figure 2
Figure 2
Gsr-deficient mice display increased mortality and elevated bacterial burden after S. aureus infection. A. Survival curves for wildtype and Gsr-null mice after S. aureus challenge. S. aureus (FDA 209P) were introduced i.v. at a dose of 4.0×10⁸ CFU per mouse. Survival of mice (n = 6 for wildtype; n = 7 for Gsr-null) were monitored for 5 days. B. Bacterial burden in the blood and spleens after S. aureus challenge. Mice were infected i.v. with S. aureus (FDA 209P) at a dose of 2.0×10⁸ CFU per animal, and euthanized 24 h later. Blood and spleens were harvested aseptically, and bacterial load was assessed by culture on TSB agar plates. Bars represent the median values. ***, p < 0.001, comparing between genotypes (student’s t-test).
Figure 3
Figure 3
Histological images of the livers and spleens of E. coli-infected wildtype and Gsr-deficient mice. Mice were challenged i.p. with E. coli (O55:B5) at a dose of 8.3 ×10⁶ CFU/g b.w, and euthanized 24 h later. The livers and spleens were fixed, and tissue sections were stained with H&E, or subjected to TUNEL assays. A. Histology of the livers of E. coli-infected wildtype and Gsr-deficient mice prepared by H&E staining. Large number of neutrophils and dead hepatocytes are seen in the necrotic foci. B. Histology of the spleens of E. coli-infected wildtype and Gsr-deficient mice prepared by H&E staining. Panels in the center column represent the low magnification images of the spleens. Note the blurred boundaries between white and red pulp in the wildtype mice, while the boundaries between white and red pulp in the Gsr-deficient mice are well defined. Panels in the left column represent the high magnification of the red pulp regions. Note the markedly more abundant neutrophils in the Gsr-deficient mice. Panels in the right column represent the high magnification of the white pulp regions. Note the massive cell death in the white pulps of wildtype mice but not in the Gsr-deficient mice. C. Apoptotic cells detected by TUNEL assays in the white pulps of the spleens. Paraffin-embedded spleen sections were subjected to TUNEL assays to detect apoptotic cells. The section was counter stained with hematoxylin. Apoptotic cells are stained brown in the spleen sections. Scale bars in A-C indicate 100 μm except in the center column of B where the bars indicate 1 mm. Results shown are representative images.
Figure 4
Figure 4
Gsr-deficient mice develop cytokine storm after E. coli challenge. Mice were challenged i.p. with E. coli (O55:B5) at a dose of 8.3 ×10⁶ CFU/g b.w., and euthanized at the indicated time points. Blood was collected by cardiac puncture, and cytokines and chemokines in the serum were measured by ELISA. Data in the graphs represent mean ± SEM of at least 4 independent experiments. *, p < 0.05; **, p < 0.01; ***, p < 0.001, comparing between genotypes (Wilcoxon’s signed rank test).
Figure 5
Figure 5
Compromised phagocytosis and ex vivo bacterial killing in Gsr-deficient neutrophils. A. Impaired phagocytic function of Gsr-deficient neutrophils towards E. coli. Bone marrow neutrophils isolated from wildtype or Gsr-deficient mice were incubated with pHrodo-conjugated (Upper row) or Texas Red (TxRed)-conjugated E. coli (Lower row) bioparticles (200 μg/ml) on ice (control) or at 37 °C for 1 h (E. coli), and then analyzed by flow cytometry. Representative histogram data are shown. Graphs on the right depict the MFI of E. coli particles engulfed by neutrophils. B. Killing of E. coli (O55:B5) in vitro by wildtype and Gsr-deficient phagocytes. Left graph: Bone marrow neutrophils (106) were incubated with serum-opsonized E. coli (107 CFU) for 15 min at 37°C. As a control, the bacteria were also incubated with medium that contains no leukocytes. Right Graph: Whole blood samples (100 μl) were incubated with E. coli (107 CFU) at 37°C for 15 min. As a control, the bacteria were incubated with 100 μl serum. After incubation, the leukocytes were lysed with saponin and live bacteria were counted after culture on LB agar plates. Survival of bacteria was calculated as CFUneutrophil or blood/CFUmedium or serum×100%. Data in the graphs represent mean ± SEM of at least 3 independent experiments. *, p < 0.05; **, p < 0.01; ***, p < 0.001 (Wilcoxon’s signed rank test).
Figure 6
Figure 6
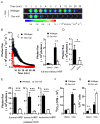
Gsr deficiency results in compromised phagocytic oxidative burst ex vivo following PMA stimulation. A. Dynamic luminol chemiluminescence of PMA-stimulated blood leukocytes. Wildtype and Gsr-deficient mice were euthanized and blood was harvested by cardiac puncture. Blood cells were pelleted from 200 μl blood by centrifugation, and RBCs were lysed. The leukocytes were used to assess the oxidative burst following PMA stimulation in black 96 well plates, using luminol chemiluminescence in a Xenogen IVIS Spectrum imaging system. At t=0, PMA (5 μM) was added. Bioluminescence was monitored by taking sequential images (exposure time, 1 min; FOV, C; binning, 8) for 1 h. Photon influx images at indicated time points are shown. B. Kinetics of oxidative burst in PMA-stimulated blood leukocytes ex vivo over 60 min. Photon influx in the wells at different time points were quantified and plotted against time in the graph. *, p < 0.05, comparing the two groups over time (two-way ANOVA). n=3. C. Total ROS production in blood leukocytes during 60 min. Total photon influx over 60 min was used as a surrogate for the accumulative ROS production. D. Effect of BCNU on the PMA-induced oxidative burst in wildtype blood leukocytes. Wildtype blood leukocytes were treated with BCNU (1 μM) for 30 min, and then stimulated with 5 μM PMA for assaying the oxidative burst. E. Comparison of total, intracellular, and extracellular ROS production between wildtype and Gsr-deficient blood leukocytes. The oxidative burst was assessed by luminol chemiluminescence in the presence of HRP (representing total ROS produced, left graph), or HRP plus SOD and catalase (representing intracellular ROS produced, middle graph). Extracellular ROS was assessed using isoluminol in the presence of HRP. F. HMPS activity in wildtype and Gsr-deficient neutrophils. Neutrophils were purified from bone marrow by Percoll gradient centrifugation. The neutrophils were stimulated either with vehicle (DMSO) or with PMA for 2 h in the presence of D-glucose-1-14C. HMPS activity in the neutrophils was measured by assessing 14CO2 production. Radioactivity in the captured 14CO2 was measured in a scintillation counter. G. The effect of PMA on neutrophil viability. Bone marrow neutrophils were stimulated with PMA (5 μM) or vehicle (DMSO) for 60 min. The viability of the cells was assessed by flow cytometry after incubated with PI. The portion of nonviable cells was expressed as percentage of PI+ cells. Results shown in A are representative images. Values in bar graphs in panels CG represent mean ± SEM from at least 3 independent experiments. *, p < 0.05; **, p < 0.01; ***, p < 0.001, comparing the two similarly treated groups (Wilcoxon’s signed rank test).
Figure 7
Figure 7
Gsr deficiency compromises the E. coli-induced phagocytic oxidative burst both ex vivo and in vivo. A. ROS production measured by DHR123 oxidation in control and E. coli-stimulated blood neutrophils (PMN) and monocytes (Mo). Heparinized whole blood (100 μl) was incubated with indicated amounts of E. coli (O55:B5) in the presence of DHR123 for 15 min. The leukocytes were then stained with neutrophil and monocyte markers, and the oxidative burst activity in these cell populations was analyzed by flow cytometry. Percentages of neutrophils or monocytes that underwent oxidative burst (rhodamine 123+ cells, left column) and the mean intensity of oxidative burst in these rhodamine123+ cells (MFI, right column) are shown. Values in bar graphs represent mean ± SEM from at least 3 independent experiments. *, p < 0.05 (Wilcoxon’s signed rank test). B. The oxidative burst in vivo in E. coli-challenged wildtype and Gsr-deficient mice detected by luminol chemiluminescence. Uninfected (control) or E. coli-infected mice were administered luminol (200 μg/g b.w.) at different time points post E. coli challenge (O55:B5, 8.3×10⁶ CFU/g b.w.) to collect luminescent images (exposure time, 5 min; FOV, D; binning, 8). Control animals were given luminol only, the remaining were infected i.p. with E. coli and given luminol at the indicated time points.
Figure 8
Figure 8
PMA-stimulated Gsr-deficient neutrophils exhibit defects in NET formation. A. Sytox Green staining of DNA of wildtype and Gsr-deficient neutrophils. Bone marrow neutrophils were seeded on uncoated glass coverslips and cultured in the absence (control) or presence of PMA (100 nM) for 16 h. These cells were then stained with Sytox Green to detect their DNA. Cells were examined under a confocal microscope. Images were Z-stack projections constructed using LSM ZEN software. B. Quantification of NET formation in wildtype and Gsr-deficient neutrophils stimulated with PMA or unstimulated (control). Neutrophils stained with Sytox Green as in A were categorized according to their morphologies into 4 subsets (lobulated neutrophils, delobulated neutrophils, diffused and spread NETs). Percentage of each subset is shown in the graphs as mean ± SEM from at least 3 independent experiments. **, p < 0.01; ***, p < 0.001 (Wilcoxon’s signed rank test). C. Immunofluorescence of NETs in control and PMA-treated wildtype and Gsr-deficient neutrophils. Neutrophils were treated as in A, and were then subjected to immunofluorescence with antibodies against neutrophil elastase (NE, green) and histone 2A.X (magenta). Finally, DNA was stained with Hochest 33342 (blue), and the cells were examined with confocal microscopy. Three dimensional immunofluorescence images were obtained using z-stack projections. Images shown are representative of at least 3 independent experiments. Scale bars indicate 10 μm.
Figure 9
Figure 9
Gsr-deficient neutrophils fail to develop the characteristic NETs upon stimulation with PMA or E. coli. Bone marrow neutrophils were seeded on uncoated glass coverslips. These cells were stimulated for 16 h with DMSO (vehicle control) or PMA (100 nM) or with E. coli at a MOI of 50, and subjected to scanning electron microscopy analysis. Images are representative of at least 3 independent experiments. Scale bars indicate either 3 μm (lower magnification images) or 0.6 μm (higher magnification images).

Similar articles

Cited by

References

    1. Klebanoff SJ, Clark RA. The neutrophil: Function and clinical disorders. North-Holland Publishing Company; Amsterdam: 1978.
    1. Balija TM, Lowry SF. Lipopolysaccharide and sepsis-associated myocardial dysfunction. Curr Opin Infect Dis. 2011;24:248–253. - PubMed
    1. Nathan C. Neutrophils and immunity: challenges and opportunities. Nat Rev Immunol. 2006;6:173–182. - PubMed
    1. Lambeth JD. NOX enzymes and the biology of reactive oxygen. Nat Rev Immunol. 2004;4:181–189. - PubMed
    1. Babior BM. NADPH oxidase. Curr Opin Immunol. 2004;16:42–47. - PubMed

Publication types

MeSH terms

Substances