. 2012 Mar 1;188(5):2084-92.
doi: 10.4049/jimmunol.1102186. Epub 2012 Jan 25.

A transgenic model of central nervous system autoimmunity mediated by CD4+ and CD8+ T and B cells

Affiliations

A transgenic model of central nervous system autoimmunity mediated by CD4+ and CD8+ T and B cells

Ana C Anderson et al. J Immunol. .

Abstract

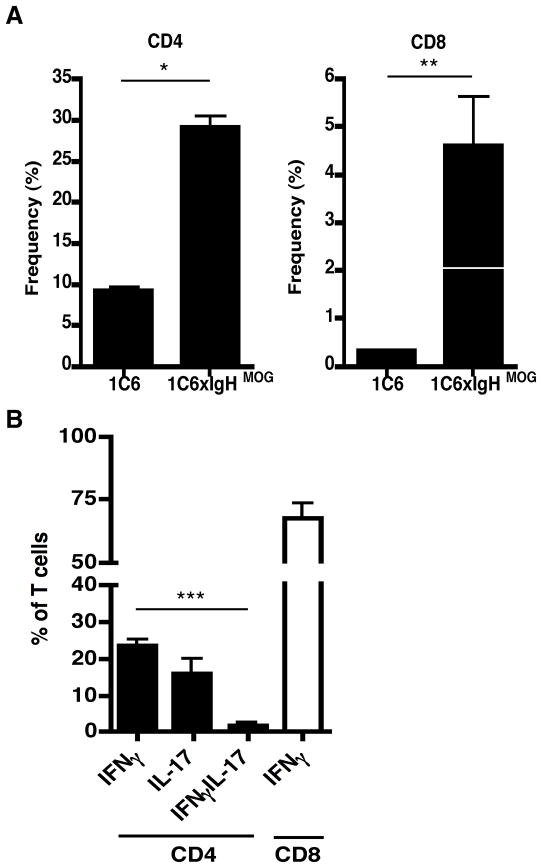
Experimental autoimmune encephalomyelitis (EAE) is a widely used model of multiple sclerosis. In NOD mice, EAE develops as a relapsing-remitting disease that transitions to a chronic progressive disease, making the NOD model the only mouse model that recapitulates the full clinical disease course observed in most multiple sclerosis patients. We have generated a TCR transgenic mouse that expresses the α- and β-chains of a myelin oligodendrocyte glycoprotein (MOG) 35-55-reactive TCR (1C6) on the NOD background. 1C6 TCR transgenic mice spontaneously generate both CD4(+) and CD8(+) T cells that recognize MOG and produce proinflammatory cytokines, allowing for the first time to our knowledge the simultaneous examination of myelin-reactive CD4(+) and CD8(+) T cells in the same host. 1C6 CD8(+) T cells alone can induce optic neuritis and mild EAE with delayed onset; however, 1C6 CD4(+) T cells alone induce severe EAE and predominate in driving disease when both cell types are present. When 1C6 mice are crossed with mice bearing an IgH specific for MOG, the mice develop spontaneous EAE with high incidence, but surprisingly the disease pattern does not resemble the neuromyelitis optica-like disease observed in mice bearing CD4(+) T cells and B cells reactive to MOG on the C57BL/6 background. Collectively, our data show that although myelin-reactive CD8(+) T cells contribute to disease, disease is primarily driven by myelin-reactive CD4(+) T cells and that the coexistence of myelin-reactive T and B cells does not necessarily result in a distinct pathological phenotype.


Figures

Figure 1
Figure 1
Flow cytometric analysis of thymocytes and peripheral T cells in 1C6 TCR transgenic mice. Thymocytes (A) and splenocytes (B) from 7 week old female 1C6 transgenic (line#1191) and wild type littermate were stained with antibodies against CD4, CD8, and Vβ7. Data shown are representative of 8 independent analyses of 6–13 week old male and female mice across three independent founder lines.
Figure 2
Figure 2
T cell responses in 1C6 TCR transgenic mice. Splenocytes from 1C6 transgenic (line#1183) and wild type littermates were stimulated with MOG 35–55 as indicated (A) and recombinant MOG (B) at 50 μg/ml. (C) Sorted CD4+ and CD8+ T cells from 1C6 mice were stimulated with MOG 35–55 (100 μg/ml) and rMOG (50 μg/ml). Proliferation was determined by [3H]Thymidine incorporation of triplicate wells. At 48 h, supernatants were harvested for measurement of production of the indicated cytokines by cytometric bead array (CBA). Data shown are representative of 2–3 independent experiments for each founder line. Error bars indicate s.e.m.
Figure 3
Figure 3
Function of CD8+ T cells in 1C6 TCR transgenic mice. 1C6 transgenic (line#1183) and wild type littermate were immunized with 10 μg of MOG 35–55 peptide emulsified in complete Freund’s adjuvant supplemented with 4 mg/ml of Mycobacterium tuberculosis (H37RA). Each mouse also received 200 ng of pertussis toxin intravenously on Days 0 and 2. On Day 7, cells were harvested from draining lymph nodes and stimulated with MOG 35–55 peptide as indicated for 4 h. Cells were stained with antibodies against CD8, CD107a (LAMP-1) and Granzyme B or IFN-γ. Expression of CD107a and Granzyme B or IFN-γ is shown on gated CD8+VB7+ (Tg) and total CD8+ (WT) T cells. Data shown are representative of five independent experiments.
Figure 4
Figure 4
EAE induced by 1C6 CD4+ and CD8+ T cells. CD4+ and CD8+ T cells from 1C6 mice were transferred either alone or together into NOD.Scid recipients. On Day 21 post transfer mice were immunized for EAE with MOG 35-55/CFA and administered Pertussis toxin.
Figure 5
Figure 5
Active disease induction in 1C6 Tg mice. 10 week old female 1C6 Tg (n=4) and wild-type littermates (n=4) were immunized with 10 μg of MOG 35-55/CFA and administered 200 ng pertussis toxin intravenously on Days 0 and 2. Immunized mice were monitored for the development of EAE. A) The mean clinical disease score is shown. Error bars indicate SEM. (B and C) Mononuclear cells were isolated from the CNS of 1C6 Tg mice with EAE (score 2–2.5). Cells were stimulated with PMA/ionomycin prior to staining with antibodies against CD4 and CD8 and the examination of intracellular cytokine production by flow cytometry. Data shown are the mean of three independent experiments. Error bars indicate s.e.m. * denotes p<0.05, one-way ANOVA, Tukey’s multiple comparison test.
Figure 6
Figure 6
Responses to MOG 35-55 and rMOG in 1C6 and 1C6 x IgHMOG mice. Splenocytes from 1C6 transgenic (line#1183) and 1C6 x IgHMOG were stimulated with MOG 35-55 (A) and recombinant MOG (B) as indicated. Proliferation (A and B) was determined by [3H]Thymidine incorporation of triplicate wells. Data shown are representative of 3 independent experiments. At 48 hours supernatants were harvested for measurement of cytokine production by cytometric bead array (CBA) and ELISA (C). Data shown are the mean of three independent experiments. *p=0.027. Error bars indicate s.e.m.
Figure 7
Figure 7
Disease in 1C6 x IgHMOG mice. (A and B) Mononuclear cells were isolated from the CNS of 1C6 and IC6 x IgHMOG mice with EAE (score 2–2.5). Cells were stimulated with PMA/ionomycin prior to staining with antibodies against CD4 and CD8 and the examination of intracellular cytokine production by flow cytometry. Data shown are the mean of three independent experiments. Error bars indicate s.e.m. * denotes p=0.0002, unpaired t-test, **p=0.014, unpaired t-test, ***p<0.05, one-way ANOVA, Tukey’s multiple comparison test. Data shown are representative of 2–3 independent experiments for each founder line. Error bars indicate s.e.m.

References

    1. Encinas JA, Wicker LS, Peterson LB, Mukasa A, Teuscher C, Sobel R, Weiner HL, Seidman CE, Seidman JG, Kuchroo VK. QTL influencing autoimmune diabetes and encephalomyelitis map to a 0.15-cM region containing IL2. Nat Genet. 1999;21:158–160. - PubMed
    1. Vyse TJ, Todd JA. Genetic analysis of autoimmune disease. Cell. 1996;85:311–318. - PubMed
    1. Becker KG, Simon RM, Bailey-Wilson JE, Freidlin B, Biddison WE, McFarland HF, Trent JM. Clustering of non-major histocompatibility complex susceptibility candidate loci in human autoimmune diseases. Proc Natl Acad Sci USA. 1998;95:9979–9984. - PMC - PubMed
    1. Goverman J, Woods A, Larson L, Weiner LP, Hood L, Zaller DM. Transgenic mice that express a myelin basic protein -specific T cell receptor develop spontaneous autoimmunity. Cell. 1993;72:551–560. - PubMed
    1. Liu GY, Fairchild PJ, Smith RM, Prowle JR, Kioussis D, Wraith DC. Low Avidity Recognition of Self-Antigen by T Cells Permits Escape from Central Tolerance. Immunity. 1995;3:407–415. - PubMed

Publication types

MeSH terms

Substances