. 2012 Mar;158(3):1439-50.
doi: 10.1104/pp.111.192013. Epub 2012 Jan 25.

Identification of high-temperature-responsive genes in cereals

Affiliations

Identification of high-temperature-responsive genes in cereals

Megan N Hemming et al. Plant Physiol. 2012 Mar.

Abstract

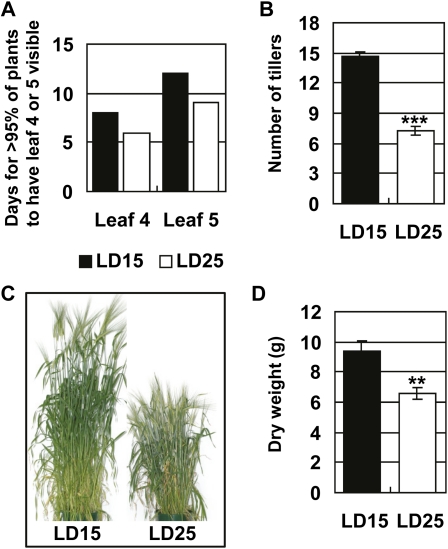
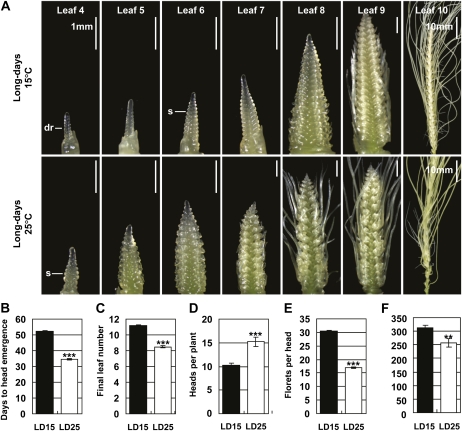
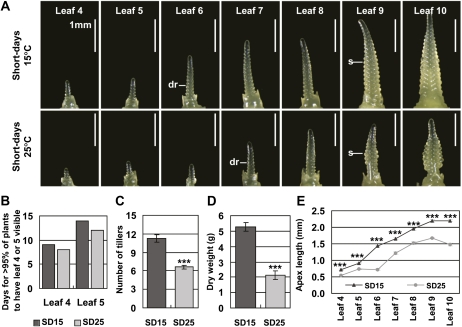
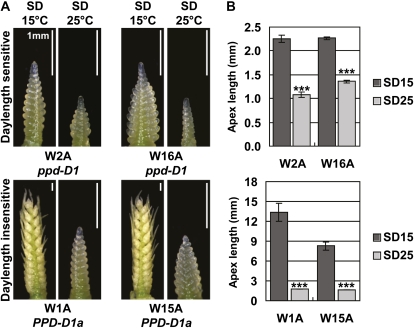
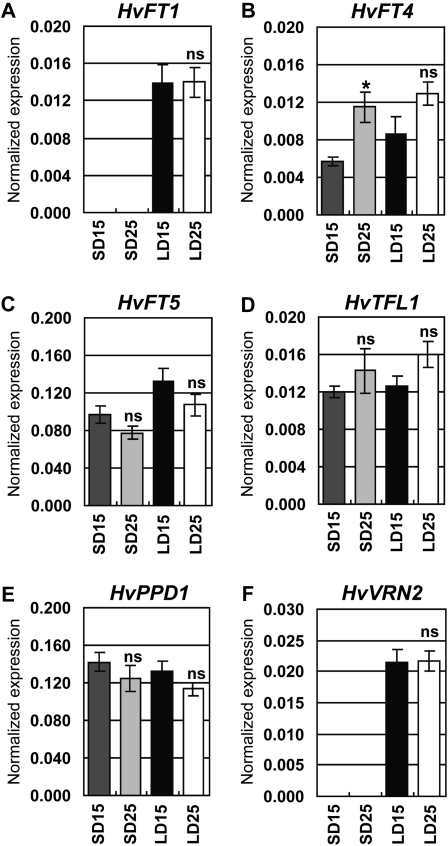
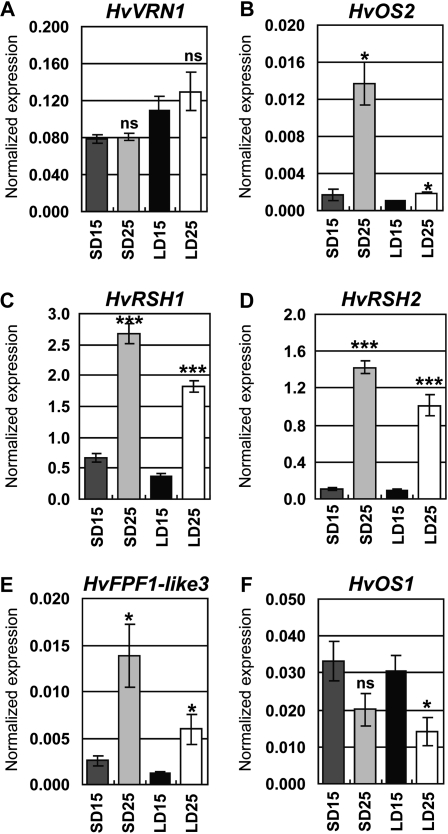
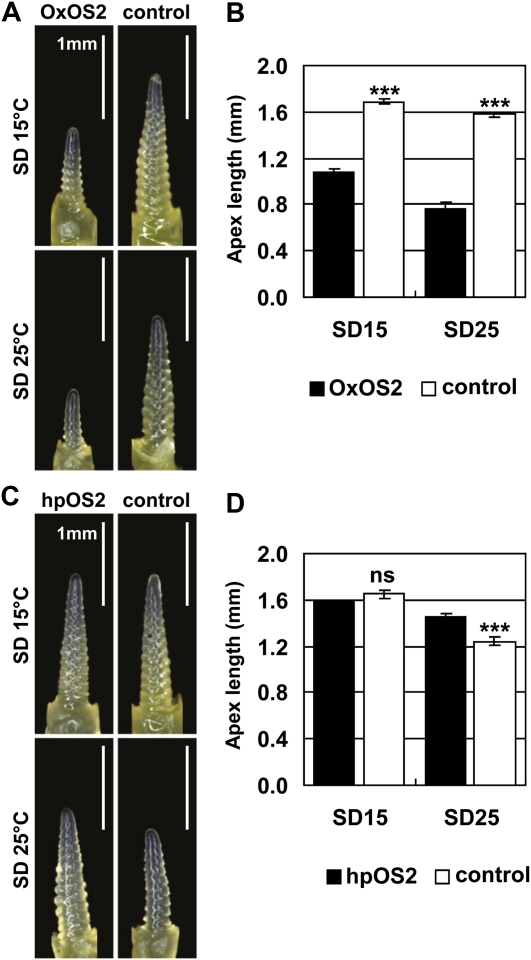
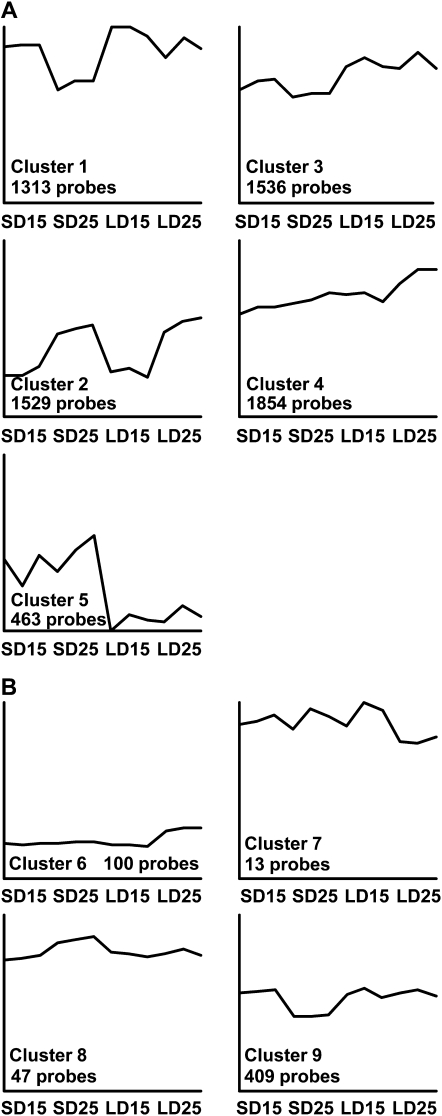
High temperature influences plant development and can reduce crop yields. We examined how ambient temperature influences reproductive development in the temperate cereals wheat (Triticum aestivum) and barley (Hordeum vulgare). High temperature resulted in rapid progression through reproductive development in long days, but inhibited early stages of reproductive development in short days. Activation of the long-day flowering response pathway through day-length-insensitive alleles of the PHOTOPERIOD1 gene, which result in high FLOWERING LOCUS T-like1 transcript levels, did not allow rapid early reproductive development at high temperature in short days. Furthermore, high temperature did not increase transcript levels of FLOWERING LOCUS T-like genes. These data suggest that genes or pathways other than the long-day response pathway mediate developmental responses to high temperature in cereals. Transcriptome analyses suggested a possible role for vernalization-responsive genes in the developmental response to high temperature. The MADS-box floral repressor HvODDSOC2 is expressed at elevated levels at high temperature in short days, and might contribute to the inhibition of early reproductive development under these conditions. FLOWERING PROMOTING FACTOR1-like, RNase-S-like genes, and VER2-like genes were also identified as candidates for high-temperature-responsive developmental regulators. Overall, these data suggest that rising temperatures might elicit different developmental responses in cereal crops at different latitudes or times of year, due to the interaction between temperature and day length. Additionally, we suggest that different developmental regulators might mediate the response to high temperature in cereals compared to Arabidopsis (Arabidopsis thaliana).


Figures

Figure 1.
Figure 1.
Ambient temperature affects plant growth. Vernalized barley plants were grown at 15°C or 25°C in long days. A, The number of days for >95% of plants in a cohort of 60 to have leaf 4 or leaf 5 visible on the main stem. B, Average tiller number per plant in plants with leaf 8 visible on the main stem. C, Plants at maturity. D, Average dry weight per plant in mature plants. LD15, Long days and 15°C; LD25, long days and 25°C. Error bars show se. Asterisks indicate the 25°C treatment is significantly different from the 15°C treatment; P values of Student’s t test: **, P < 0.01; ***, P < 0.001. [See online article for color version of this figure.]
Figure 2.
Figure 2.
Reproductive development occurs rapidly at high temperature in long days. Vernalized barley plants were grown at 15°C or 25°C in long days. A, Representative image of the main shoot apex as leaves 4 to 10 became visible on the main stem. dr indicates double ridges, the first visible sign of floral development; S, expanding spikelet primordium. The scale bar shows 1 mm unless otherwise indicated. B, Average calendar days to head emergence. C, Average final number of leaves on the main stem. D, Average number of heads per plants. E, Average number of florets per head. F, Average total number of florets per plant. LD15, Long days and 15°C; LD25, long days and 25°C. Error bars show se. Asterisks indicate the 25°C treatment is significantly different from the 15°C treatment; P values of Student’s t test: **, P < 0.01; ***, P < 0.001. [See online article for color version of this figure.]
Figure 3.
Figure 3.
Early reproductive development is inhibited by high temperature in short days. Vernalized barley plants were grown at 15°C or 25°C in short days. A, Representative image of the main shoot apex as leaves 4 to 10 became visible on the main stem. dr indicates double ridges, the first visible sign of floral development; S, expanding spikelet primordium. The scale bar shows 1 mm. B, The number of days for >95% of plants in a cohort of 60 to have leaf 4 or leaf 5 visible on the main stem. C, Average tiller number per plant in plants with leaf 8 visible on the main stem. D, Average total dry weight per plant in plants with leaf 10 visible on the main stem. E, Average length of the main shoot apex for plants in A. SD15, Short days and 15°C; SD25, short days and 25°C. Error bars show se. Asterisks indicate the 25°C treatment is significantly different from the 15°C treatment; P values of Student’s t test: ***, P < 0.001. [See online article for color version of this figure.]
Figure 4.
Figure 4.
Activation of the long-day flowering response pathway does not allow rapid early reproductive development at high temperature in short days. Early reproductive development was assayed in near-isogenic wheat lines varying for alleles of the PPD1 gene. Lines W2A and W16A carry wild-type PPD1 alleles (ppd-D1). These lines require long days to flower rapidly (day-length sensitive). Lines W1A and W15A carry a mutant PPD1 allele (PPD-D1a) that allows plants to flower rapidly in both short and long days (day-length insensitive). A, Representative image of the main shoot apex from plants grown at 15°C or 25°C in short days until leaf 8 was visible on the main stem. Scale bar shows 1 mm. B, Average length of the main shoot apex for plants in A. Error bars show se. Asterisks indicate the 25°C treatment is significantly different from the 15°C treatment; P values of Student’s t test: ***, P < 0.001. [See online article for color version of this figure.]
Figure 5.
Figure 5.
Transcript levels of genes in the long-day flowering response pathway. A to F, qRT-PCR assay of expression levels. Expression is shown relative to ACTIN. SD15, Short days and 15°C; SD25, short days and 25°C; LD15, long days and 15°C; LD25, long days and 25°C. Error bars show se. Asterisks indicate the 25°C treatment is significantly different from the 15°C treatment; P values of Students t test: *, P < 0.05. ns, Not significantly different.
Figure 6.
Figure 6.
Transcript levels of genes in the vernalization response pathway. A to F, qRT-PCR assay of expression levels. Expression is shown relative to ACTIN. SD15, Short days and 15°C; SD25, short days and 25°C; LD15, long days and 15°C; LD25, long days and 25°C. Error bars show se. Asterisks indicate the 25°C treatment is significantly different from the 15°C treatment; P values of Student’s t test: *, P < 0.05; ***, P < 0.001. ns, Not significantly different.
Figure 7.
Figure 7.
HvODDSOC2 might slow early reproductive development at high temperature. Transgenic barley lines with altered transcript levels of the HvODDSOC2 gene were grown at 15°C or 25°C in short days. A, Representative images of the main shoot apex from a trangenic line overexpressing HvODDSOC2 (OxOS2) and a nontransgenic sibling control line. Leaf 7 was visible on the main stem at 15°C and leaf 8 was visible on the main stem at 25°C. B, Average length of the main shoot apex from plants in A. C, Representative images of the main shoot apex from a transgenic line in which HvODDSOC2 transcript levels are reduced by an RNAi hairpin construct (hpOS2) and a nontransgenic sibling control line. Leaf 7 was visible on the main stem at 15°C and leaf 8 was visible on the main stem at 25°C. D, Average length of the main shoot apex from plants in C. SD15, Short days and 15°C; SD25, short days and 25°C. Error bars show se. Asterisks indicate the 25°C treatment is significantly different from the 15°C treatment; P values of Student’s t test: ***, P < 0.001. ns, Not significantly different. [See online article for color version of this figure.]
Figure 8.
Figure 8.
PAMSAM cluster analysis of differentially expressed genes. Graphs show the expression pattern of the mediod (representative gene). Y axes represent the Log2 expression value of the cluster mediod. Clusters 1 to 4 contain probes that are influenced by temperature irrespective of day length. Cluster 5 contains probes that are influenced by day length irrespective of temperature. Clusters 6 to 9 contain probes that respond to specific combinations of temperature and day length. SD15, Short days and 15°C; SD25, short days and 25°C; LD15, long days and 15°C; LD25, long days and 25°C.

Similar articles

Cited by

References

    1. Aspinall D. (1969) The effects of day length and light intensity on the growth of barley. Aust J Biol Sci 22: 53–67
    1. Asseng S, Foster I, Turner N. (2011) The impact of temperature variability on wheat yields. Glob Change Biol 17: 997–1012
    1. Balasubramanian S, Sureshkumar S, Lempe J, Weigel D. (2006) Potent induction of Arabidopsis thaliana flowering by elevated growth temperature. PLoS Genet 2: e106. - PMC - PubMed
    1. Beales J, Turner A, Griffiths S, Snape JW, Laurie DA. (2007) A pseudo-response regulator is misexpressed in the photoperiod insensitive Ppd-D1a mutant of wheat (Triticum aestivum L.). Theor Appl Genet 115: 721–733 - PubMed
    1. Benjamini Y, Hochberg Y. (1995) Controlling the false discovery rate—a practical and powerful approach to multiple testing. J R Stat Soc Ser B Methodol 57: 289–300

Publication types

MeSH terms