Comparative Study
. 2012 Jan 25;32(4):1156-70.
doi: 10.1523/JNEUROSCI.3630-12.2012.

Renshaw cells and Ia inhibitory interneurons are generated at different times from p1 progenitors and differentiate shortly after exiting the cell cycle

Affiliations
Comparative Study

Renshaw cells and Ia inhibitory interneurons are generated at different times from p1 progenitors and differentiate shortly after exiting the cell cycle

Ana Benito-Gonzalez et al. J Neurosci. .

Abstract

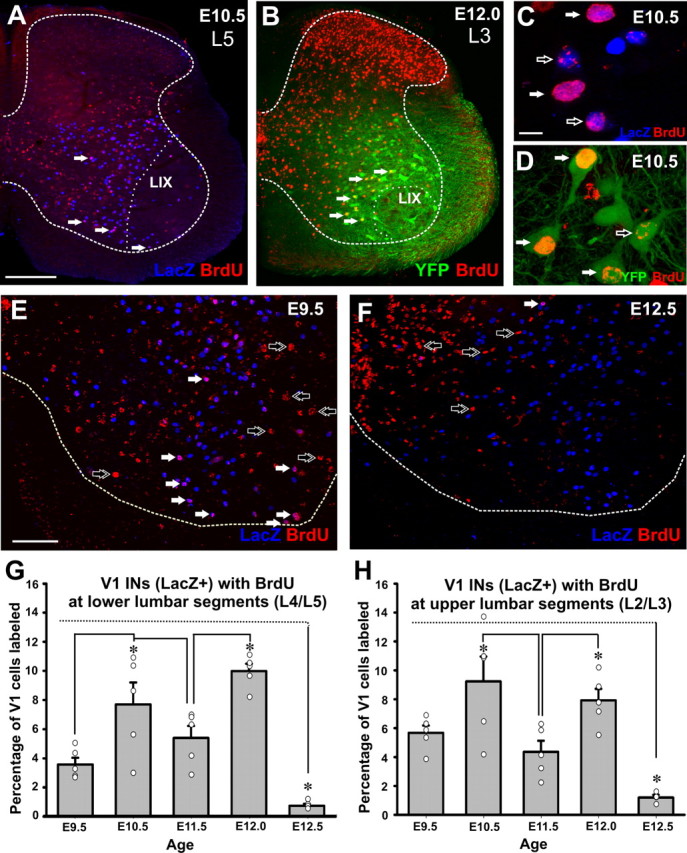
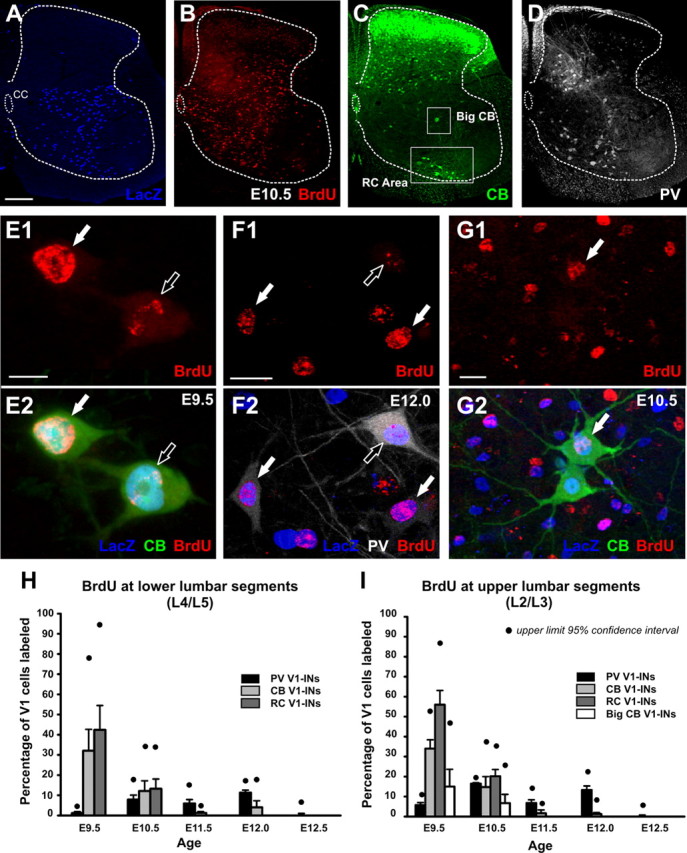
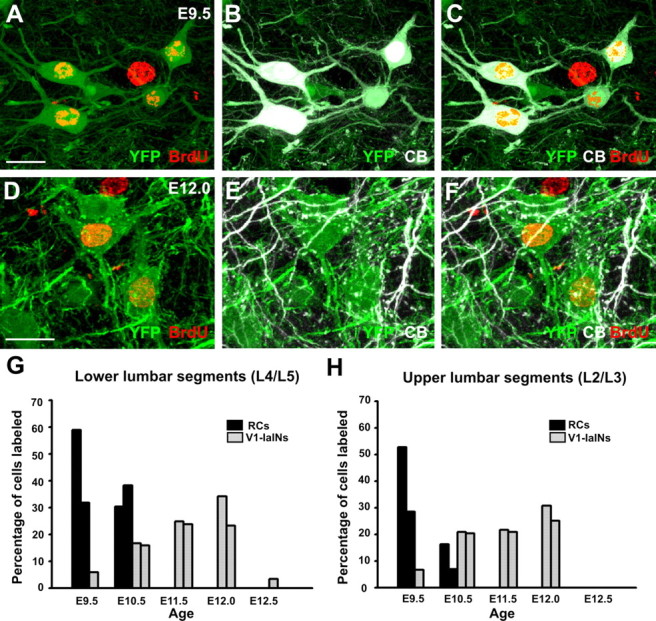
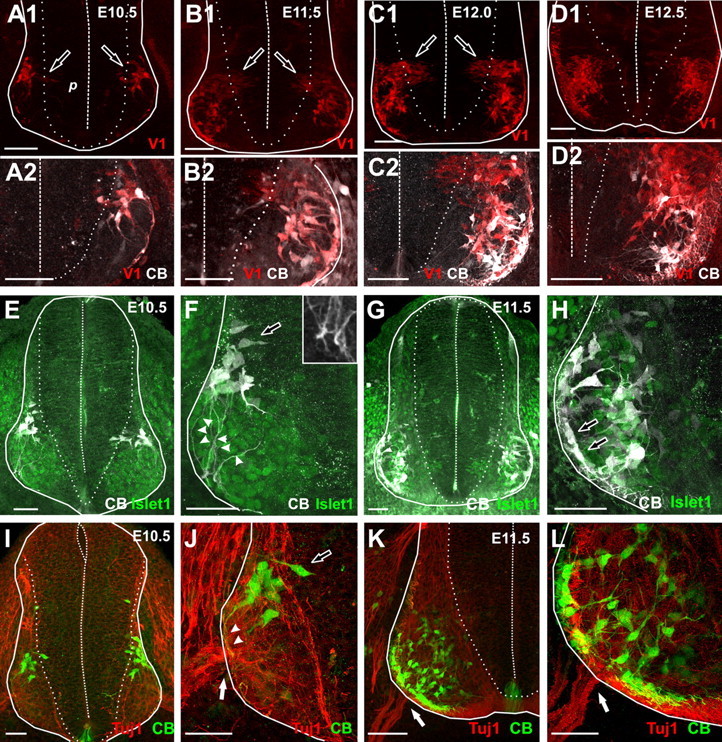
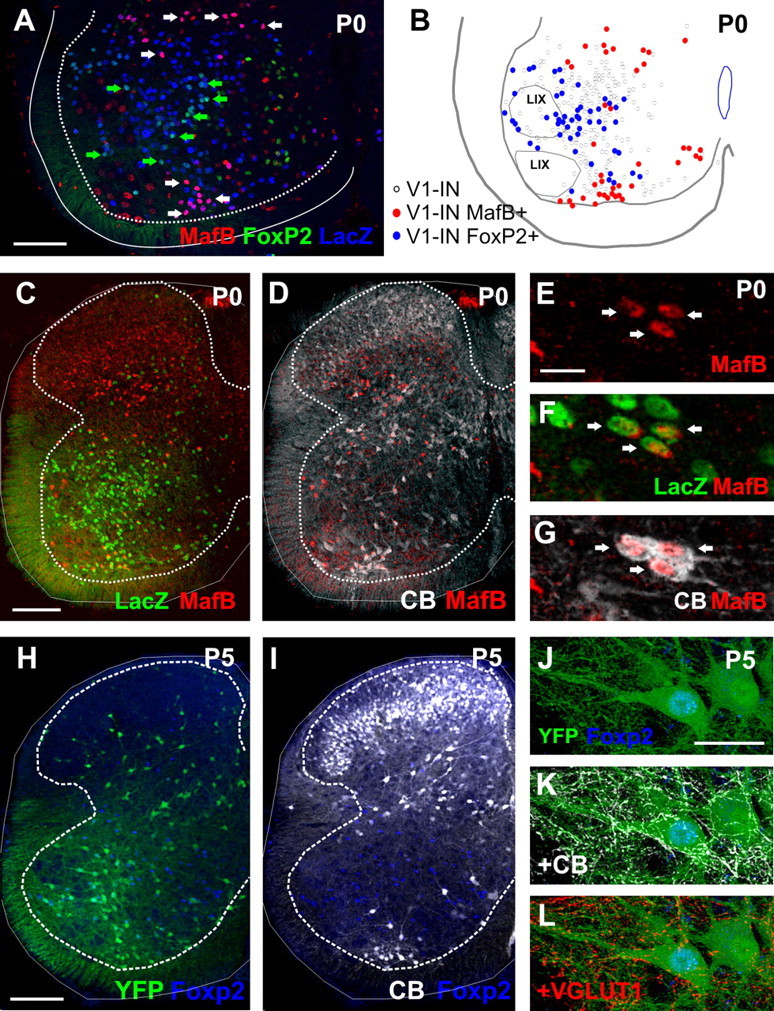
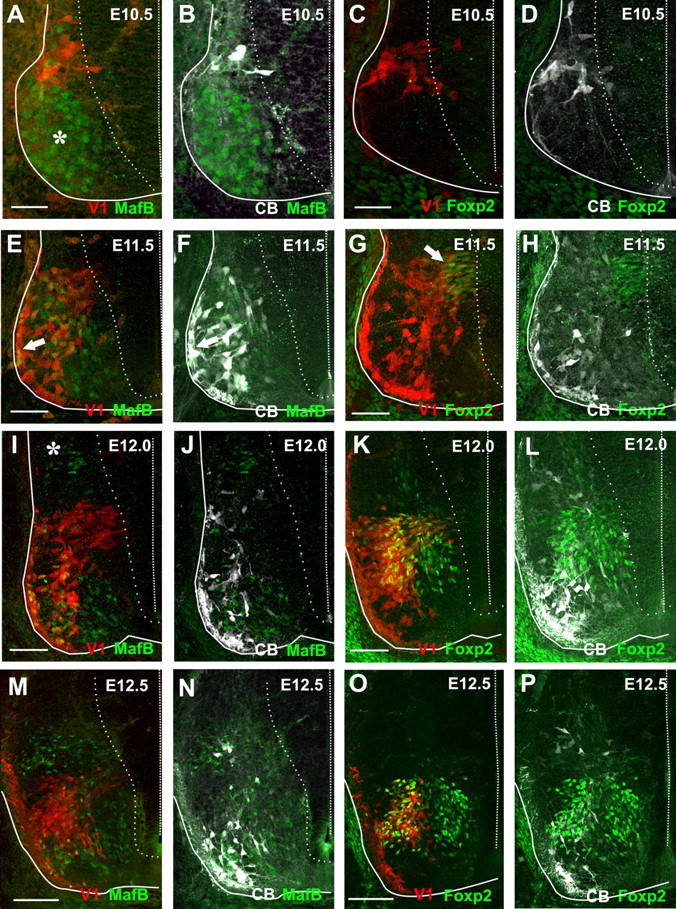
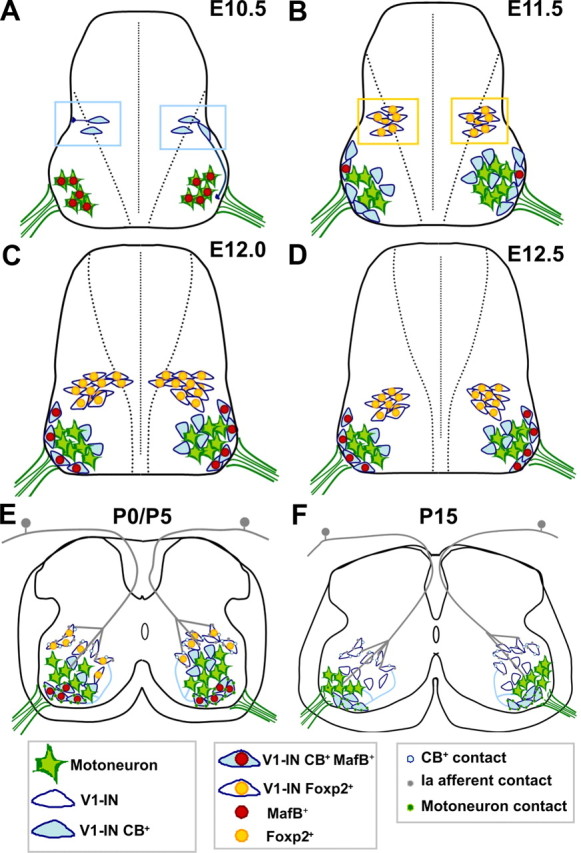
Spinal interneurons modulating motor output are highly diverse but surprisingly arise from just a few embryonic subgroups. The principles governing their development, diversification, and integration into spinal circuits are unknown. This study focuses on the differentiation of adult Renshaw cells (RCs) and Ia inhibitory interneurons (IaINs), two subclasses that respectively mediate recurrent and reciprocal inhibition of motoneurons from embryonic V1 interneurons (V1-INs). V1-INs originate from p1 progenitors and, after they become postmitotic, specifically express the transcription factor engrailed-1, a property that permits genetic labeling of V1 lineages from embryo to adult. RCs and IaINs are V1 derived, but differ in morphology, location, calcium-binding protein expression, synaptic connectivity, and function. These differences are already present in neonates, and in this study we show that their differentiation starts in the early embryo. Using 5'-bromodeoxyuridine birth dating we established that mouse V1-INs can be divided into early (E9.5-E10.5) and late (E11.5-E12.5) groups generated from the p1 domain (where E is embryonic day). The early group upregulates calbindin expression soon after becoming postmitotic and includes RCs, which express the transcription factor MafB during early differentiation and maintain calbindin expression throughout life. The late group includes IaINs, are calbindin-negative, and express FoxP2 at the start of differentiation. Moreover, developing RCs follow a characteristic circumferential migratory route that places them in unique relationship with motor axons with whom they later synaptically interact. We conclude that the fate of these V1-IN subclasses is determined before synaptogenesis and circuit formation by a process that includes differences in neurogenesis time, transcription factor expression, and migratory pathways.


Figures

Figure 1.
Figure 1.
BrdU labeling of V1 interneurons. A, B, Low-magnification confocal images of lumbar spinal cord hemisections showing BrdU-IR (Cy3, red) and LacZ-positive V1-INs in En1-Cre/Tau-LacZ (A, blue, α-galactosidase-IR) or YFP-positive V1-INs in En1-Cre/Thy1-YFP (B, green) mice. A, Lower lumbar 5 (L5) section from a P15 animal pulse-labeled with BrDU at E9.5. B, Upper L3 section from a P15 animal treated with BrdU at E12.0. The borders between white and gray matter (dashed line) and lamina IX (LIX, dotted line) are indicated. Arrows indicate V1-INs labeled with BrdU. C, D, High-magnification confocal images of BrdU-IR in nuclei of V1 LacZ-positive cells (C, En1-Cre/Tau-lacZ animal) and V1 YFP-positive cells (D, En1-Cre/Thy1-YFP animal). LacZ is directed to the nucleus while YFP fills cell bodies, nuclei, dendrites, and axons. Solid white arrows indicate strongly BrdU-labeled nuclei and open arrows indicate weak labeling. E, F, P15 ventral horns with LacZ-positive V1-INs (blue) and BrdU incorporation (red) at E9.5 (E) and E12.5 (F). Dotted lines indicate the border between white and gray matter. Arrows show cells with strong BrdU incorporation; solid white arrows are V1-INs, double open arrows are non-V1 INs. Many large motoneuron nuclei are labeled at E9.5. G, H, Percentages of P15 V1-INs strongly labeled with BrdU at different embryonic ages. G, Analyses at lower lumbar 4 and 5 segments. H, Upper lumbar 2 and 3 segments. Data from En1-Cre/Tau-LacZ and En1-Cre/Thy1-YFP mouse lines were pooled together; n = 5 animals except for E12.5, where n = 4. Error bars indicate SEM. Individual animal values are superimposed as scatter plots (clear circles). Data from each animal were estimated from analyses of 10 ventral horns and an average of 1503 ± 231 (±SD) V1 INs per animal/lumbar region in En1-Cre/Tau-LacZ line and 1139 ± 119 (±SD) in En1-Cre/Thy1-YFP animals. The smaller number of genetically labeled cells in the En1-Cre/Thy1-YFP line corresponds with the known mosaicism of expression imposed by the Thy1 promoter (see Siembab et al., 2010). Percentages of BrdU-labeled cells were consistent between lines, and therefore the data from animals in both lines were pooled together. The results show two peaks of V1 generation at E10.5 and E12 in both upper and lower lumbar segments and very few cells incorporating BrdU at E12.5. ANOVA comparisons indicated significant differences among the ages (p < 0.001), and post hoc pairwise analyses (Tukey test) showed significant differences (p < 0.05) as indicated by asterisks. BrdU incorporation in V1-INs at E10.5 always shower higher variability than at the other ages and did not reach significance in upper lumbar segments compared to E9.5 (p = 0.1, Tukey's test). Scale bars: (in A) A, B, 200 μm; (in C) C, D, 10 μm; (in E) E, F, 100 μm.
Figure 2.
Figure 2.
BrdU labeling in V1-derived interneurons expressing different calcium-binding proteins at P15. AD, Low-magnification confocal images of a lumbar 4 spinal cord hemisection quadruple immunolabeled for β-gal (Alexa Fluor 405, blue, A), BrdU (Cy3, red; B), calbindin (CB; FITC, green; C), and parvalbumin (PV; Cy5, white; D). This particular animal was exposed to BrdU at E10.5. Ventrally located calbindin-IR V1-INs correspond with Renshaw cells (RC area, lower box in C). In addition, a few V1-derived calbindin-IR cells were located more dorsally and are different from Renshaw cells. These were divided into large and small cells according to soma size. Large V1 calbindin-IR cells (Big CB, upper box in C) were detected only in upper lumbar regions. Parvalbumin-IR cells are scattered throughout the ventral horn and present many different morphologies and sizes (D). The dotted lines delineate the borders between the white and gray matter. CC in A indicates the central canal position. E, G, High-magnification images of BrdU labeling in different types of V1-INs. E1, E2, E9.5 BrdU incorporation in calbindin-IR V1-derived Renshaw cells. In these and following image pairs, solid arrows indicate strong BrdU labeling; open arrows weakly labeled nuclei. F1, F2, E12 BrdU labeling in non-Renshaw parvalbumin-IR V1-INs. G1, G2, E10.5 BrdU incorporation in dorsal large calbindin-IR V1-INs. Only one of them (arrow) is strongly labeled with BrdU. H, I, Percentages of parvalbumin-IR V1-INs (non-Renshaw, black bars), all calbindin-IR V1-INs (light gray bars), calbindin-IR Renshaw cells (dark gray bars), and big calbindin-IR V1-INs (white bars, only in the upper lumbar segments) strongly labeled with BrdU at five different embryonic ages. Each bar represents the average from n = 3 En1-Cre/Tau-LacZ animals at each embryonic injection time except for E12.5, in which n = 2 animals. Error bars indicate SEM. Black circles indicate the 95% confidence limits. Note higher variability in the estimates for different subpopulations of calbindin-IR neurons compared to the parvalbumin group. Per animal, an average of 100.8 ± 22.7 (± SD) and 98.8 ± 27.5 (± SD) calbindin-IR V1-INs were tested for BrdU content in L4/5 and L2/3 sections, respectively. The numbers of parvalbumin V1-INs were, respectively, 81.8 ± 24.7 and 70.21 ± 32.4. Sixty to seventy percent of the calbindin-IR cells were Renshaw cells located in the ventral most region, and 5–6% correspond with big calbindin cells in upper lumbar L2/3 segments. Calbindin-IR V1 cells, including Renshaw cells and big calbindin-IR cells, were generated at E9.5 and E10.5. Few were generated at E11.5 and E12. The percentage of Renshaw cells that incorporated BrdU at E9.5 was significantly higher than at any other age in both upper and lower lumbar segments (p < 0.001 ANOVA followed by post hoc pairwise Tukey tests p < 0.05). Parvalbumin-IR V1 cells were mostly generated between E10.5 to E12 with very few incorporating BrdU at E9.5 and E12.5. E9.5 and E12.5 percentages of incorporation in parvalbumin V1-INs were significantly smaller than all other ages (p < 0.001 ANOVA followed by post hoc pairwise Tukey tests comparisons, p < 0.05). Significance is not indicated in the figure for simplicity. Scale bars: (in A) AD, 200 μm; (in E1) E1, E2, 10 μm; (in F1, G1) F1G2. 20 μm.
Figure 3.
Figure 3.
BrdU incorporation in Renshaw cells and V1-derived IaINs. AC, High-magnification confocal images of V1 YFP (green in AC) and calbindin-positive Renshaw cells (CB, white in B and C) showing generally strong BrdU labeling incorporated at E9.5 (red in A and C; because pure white masks red labeling, in C we added the red BrdU image on the YFP-CB, not just superimposed the three colors). The large nucleus of an unlabeled motoneuron in the middle of the image also incorporated BrdU at the same age. DF, High-magnification confocal images of ventral spinal cord sections showing V1-derived IaINs (YFP green labeling in all three images) in a P15 animal injected with BrdU at E12.0 (BrdU is red in G and D). Superimposition of YFP and calbindin (E) shows IaINs surrounded by pericellular baskets of V1 calbindin-IR boutons (green and white). Only cells with dense pericellular baskets were sampled. G, H, Percentages of strongly BrdU-labeled Renshaw cells (black bars) and V1-derived IaINs (gray bars) in lower (G) and upper (H) lumbar segments. Each bar represents the average percentage calculated from an individual animal (calculated from 10 ventral horns each; 65.6 ± 17.1 and 56.0 ± 13.2 Renshaw cells and 28.7 ± 10.2 and 30.7 ± 5.4 V1-IaINs analyzed per animal in upper and lower lumbar segments, respectively). The results were consistent among the two animals studied at each age. Renshaw cells incorporated BrdU only after E9.5 or E10.5 injections. Increasingly more V1-derived IaINs incorporated BrdU at older embryonic ages, with a peak at E12. Almost no V1-IaINs were found with BrdU incorporation at E12.5. Scale bars: (in A, D) AF, 20 μm.
Figure 4.
Figure 4.
Location and calbindin immunoreactivity of early embryonic V1-INs. AD, Confocal images of E10.5–E12.5 spinal cord cross sections showing tdTomato labeling of V1-INs (V1, red; A1D1, low magnification; A2D2, high magnification) and calbindin immunoreactivity (CB, white, Cy5; A2D2). Solid lines indicate the boundaries of the early spinal cord. Dotted lines indicate the border between the ventricular progenitor area (p) and the mantle layer. Dashed line indicates the midline ventricle. A, E10.5 spinal cord. Few V1-INs are present in the neural tube. Most are located laterally and a few are leaving the progenitor area (arrows in A1). All V1-INs at this age express calbindin-IR (A2). B, E11.5 spinal cord. The numbers of V1-INs and calbindin-IR cells are increased and most are ventrolaterally located. Newly formed generated cells exiting the progenitor area (arrows in B1) are calbindin negative at this age (B2). C, E12 spinal cord. At this age there is a larger number of V1-INs exiting the progenitor area (C1), and these new V1-INs lack calbindin-IR (C2). More V1-INs are accumulated ventromedially, and these can be calbindin positive or negative (C2). D, E12.5 spinal cord. Very few or no V1-INs are exiting the progenitor area (D1) and the number of calbindin-negative V1-INs in the ventral horn has significantly increased. Many are located medial and dorsal to calbindin-IR V1 INs, but there is also significant intermixing (D2). EH, Transverse sections of spinal cords from En1-Cre/R26-tdTomato embryos (tdTomato not shown) immunolabeled for calbindin (Cy5, white) and Islet1 (FITC, green). IL, Similar sections from Cre-negative littermates immunolabeled for calbindin (FITC, green) and Tuj1 (Cy3 red). Islet 1 marks the position of motor pools; Tuj1 labels axonal microtubules in undifferentiated neurons including the exit region of motor axons (ventral roots; white arrows in JL). E, I (low magnification) and F, J (high magnification) are E10.5. G, K and H, L are E11.5 respectively also at low and high magnifications. At E10.5 all calbindin-IR V1-INs are dorsal to Islet1-IR motoneuron pools (E, F). Calbindin-IR V1-INs exiting the progenitor area have mediolaterally oriented bipolar morphologies (open arrows in F and J). More lateral V1-INs located in the mantle layer have unipolar morphologies and send projections ventrally (arrowheads in F and J). These projections end in bulbs similar to growth cones (inset, F) and terminate close to the ventral root (I, J). At E11.5, the cells that were located dorsally at E10.5 have moved laterally around the motor pools and area, becoming positioned close to ventral roots. A second group of calbindin-IR V1-INs is located medial or intermingled with motoneurons. Scale bars: A1D1, 100 μm; A2L, 50 μm.
Figure 5.
Figure 5.
Expression of MafB and FoxP2 in postnatal V1-derived interneurons. A, Confocal image of a lumbar 5 spinal cord ventral horn showing triple immunolabeling for MafB (Cy3, red), FoxP2 (FITC, green), and LacZ-positive V1-INs (blue). White arrows indicate V1-INs containing high levels of MafB (thus appearing pink). Green arrows indicate V1-INs with high levels of FoxP2 (thus appearing as lighter blue). MafB and FoxP2 V1-INs are located in different regions and there is no colocalization between both subpopulations. B, Neurolucida plot of V1-INs classified according to MafB or FoxP2 expression. The positions of motor pools are indicated (LIX). C, D, Low-magnification confocal image from an En1-Cre/Tau-LacZ animal at P0 immunostained for MafB (Cy3, red; C, D), LacZ (FITC, green, C), and calbindin (Cy5, white, D; calbindin signals were lowered to allow visibility of the red marker). The ventral group of MafB-IR V1-INs is calbindin immunoreactive and coincides with Renshaw cells. E, G, High-magnification confocal images of P0 Renshaw cells (arrows) immunostained for MafB (Cy3, red), LacZ (FITC, green), and calbindin (Cy5, white). H, I, Low-magnification confocal images of lumbar spinal cord sections at P5 immunolabeled with FoxP2 (Alexa Fluor 405, blue; H, I), YFP (FITC, green; H), and calbindin (CB, Cy5, white; I). FoxP2-immunoreactive cells are for the most part localized to the ventral horn and some coincide with V1-INs, but these are never calbindin immunoreactive. JL, High-magnification confocal images of a YFP (FITC, green) V1-IN immunostained for FoxP2 (Alexa Fluor 405, blue; JL). This cell receives contacts from Renshaw cell axons that are both calbindin-immunoreactive (Cy5, white; K) and YFP-positive (J). It also receives contacts from VGLUT1 boutons (Cy3, red; L). This particular cell is therefore a V1-derived IaIN. Scale bars:in A, 200 μm; (in C, H) C, D, H, I, 100 μm; (in E, J) E–G, J–L, 20 μm.
Figure 6.
Figure 6.
Expression of MafB and FoxP2 in V1-INs in early embryos. V1-INs are labeled in red in all panels (tdTomato), MafB- (A, B, E, F, I, J, M, and N) or FoxP2-immunoreactivities (C, D, G, H, K, L, O, and P) in green (FITC) and calbindin-IR in white (Cy5, B, D, F, H, J, L, N, and P). Solid lines delineate the embryonic spinal cord, while dashed lines mark the midline. Dotted lines indicate the edge of the progenitor area. A, B, The few calbindin-IR V1-INs present at E10.5 contain weak or no MafB expression. MafB expression is mostly present in motoneurons at this age (asterisk in A). C, D, No Foxp2 immunoreactivity is visible at E10.5. E, F, At E11.5 MafB expression is partially downregulated from motoneurons and it starts to be present in laterally located calbindin-IR V1-derived Renshaw cells (arrows). G, H, At E11.5 we can also first detect Foxp2 in V1-INs; these are mostly located exiting the progenitor area in the intermediate zone (arrow in G). None of these cells express calbindin (H). I, J, At E12.0 MafB expression is greatly downregulated from motoneurons and is present in most V1-derived Renshaw cells. A group of dorsal horn MafB-positive neurons exit the progenitor area at this age (asterisk in I). K, L, At E12.0 we detected FoxP2 in V1-INs leaving the progenitor area and also in V1-INs that have already migrated ventrally and display more complex morphologies. FoxP2 V1-INs are never calbindin positive (L). M, N, By E12.5 MafB is present in Renshaw cells, a few dorsally located V1-INs, and dorsal horn INs. O, P, At E12.5 Foxp2 is present in V1-INs located mostly dorsal and medial to calbindin-IR V1-INs. Scale bars: (in A, C, E, G) A--H, 50 μm; (in I, K, M, O), IP, 100 μm.
Figure 7.
Figure 7.
Summary of Renshaw cell and V1-derived IaIN differentiation. A, At lumbar levels, V1-INs first exit the progenitor area at E10.5, upregulate immediately calbindin expression, and most appear to be Renshaw cell precursors. These cells first migrate laterally and are located dorsal to motoneurons. Once at this lateral position they extend ventral projections toward the ventral root. These ventral projections usually follow a circumferential path around motor pools at the lateral edge of the spinal cord. At this age MafB is largely expressed in motoneurons. FoxP2 is not expressed at E10.5 by any cell in the spinal cord. B, At E11.5, differentiating Renshaw cells migrate ventrally and position themselves at the motor axon exit region. At this age MafB expression is upregulated in Renshaw cells and downregulated in motoneurons. Other calbindin-IR V1-INs are located more medially to motoneurons, and these cells lack MafB. They likely develop into phenotypes other than Renshaw cells. Finally, new V1-INs exit the progenitor area at this age; these are calbindin negative and express FoxP2. Some of these “later born” V1 cells will differentiate into V1-derived IaINs. C, At E12 a large number of FoxP2-positive V1-INs are added and migrate ventrally. MafB is now expressed by all Renshaw cells. D, At E12.5 there are no more V1-INs added, and FoxP2-expressing V1-INs become located dorsal and medial to calbindin-IR V1-INs. E, During the first postnatal week, MafB and FoxP2 start to downregulate from V1-INs. At P0/P5 MafB is present in calbindin-IR V1-derived Renshaw cells that receive strong synaptic input from motor axons. These cells send projections back to motoneurons and also to other V1-INs more dorsally located. Until P5, FoxP2 expression remains in many dorsal V1-INs. Some receive convergent inputs from Ia afferents and Renshaw cells and can be defined as V1-derived IaINs. Ia afferents have invaded the ventral horn at late embryonic ages, and in their trajectory toward the motor pools they contact many V1-INs. F, At P15, Renshaw cells and V1-derived IaINs are fully matured.

References

    1. Altman J, Bayer SA. Development of the human spinal cord. Oxford: Oxford UP; 2001.
    1. Alvarez FJ, Fyffe RE. The continuing case for the Renshaw cell. J Physiol. 2007;584:31–45. - PMC - PubMed
    1. Alvarez FJ, Jonas PC, Sapir T, Hartley R, Berrocal MC, Geiman EJ, Todd AJ, Goulding M. Postnatal phenotype and localization of spinal cord V1 derived interneurons. J Comp Neurol. 2005;493:177–192. - PMC - PubMed
    1. Barber RP, Phelps PE, Houser CR, Crawford GD, Salvaterra PM, Vaughn JE. The morphology and distribution of neurons containing choline acetyltransferase in the adult rat spinal cord: an immunocytochemical study. J Comp Neurol. 1984;229:329–346. - PubMed
    1. Barber RP, Phelps PE, Vaughn JE. Generation patterns of immunocytochemically identified cholinergic neurons at autonomic levels of the rat spinal cord. J Comp Neurol. 1991;311:509–519. - PubMed

Publication types