Comparative Study
. 2012 Jan 25;32(4):1171-82.
doi: 10.1523/JNEUROSCI.5517-11.2012.

Looming signals reveal synergistic principles of multisensory integration

Affiliations
Comparative Study

Looming signals reveal synergistic principles of multisensory integration

Céline Cappe et al. J Neurosci. .

Abstract

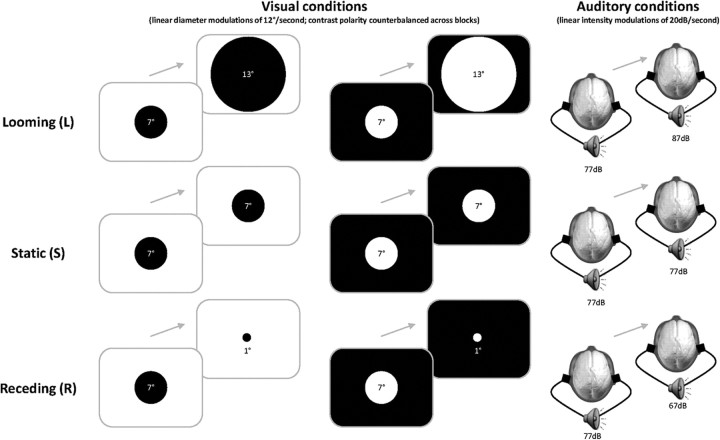
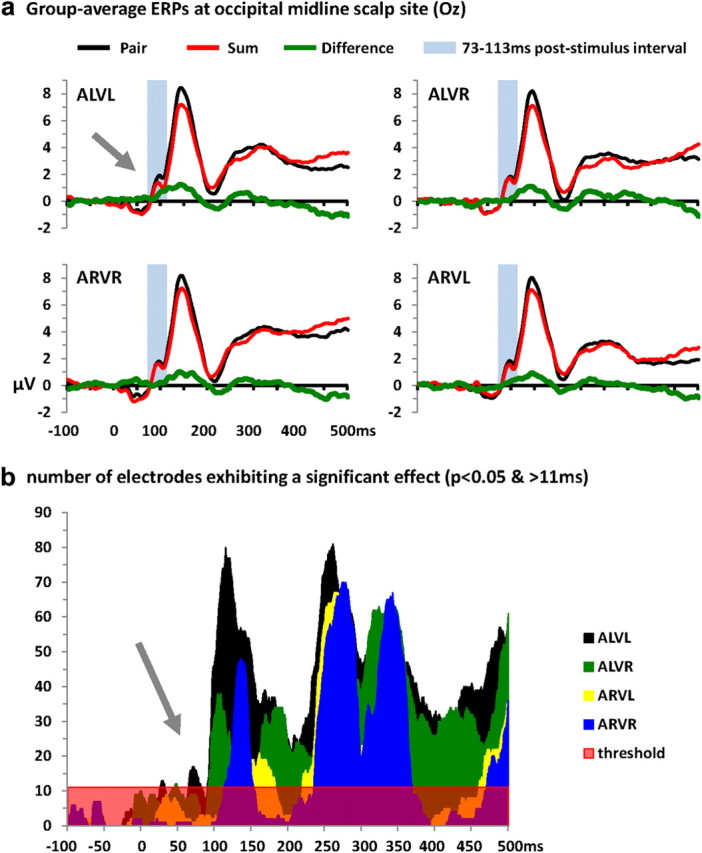
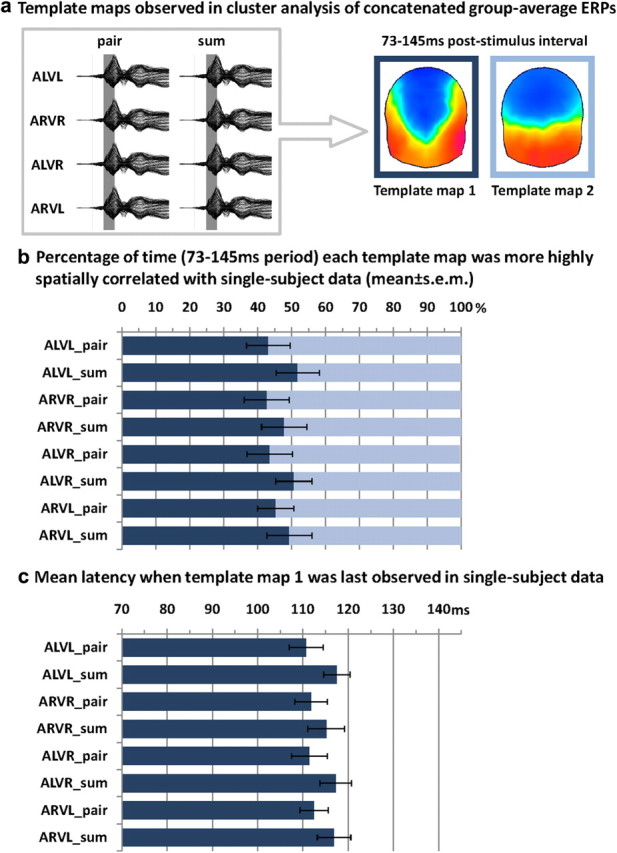
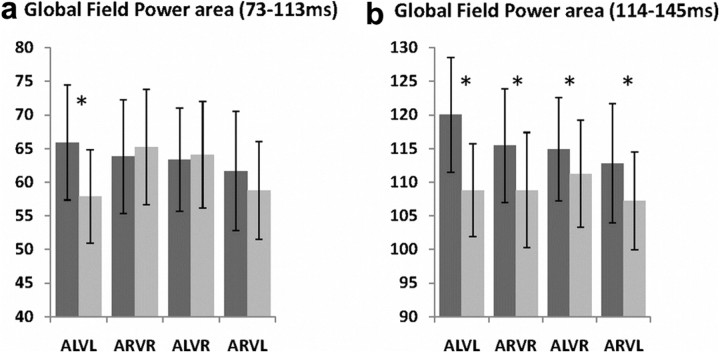
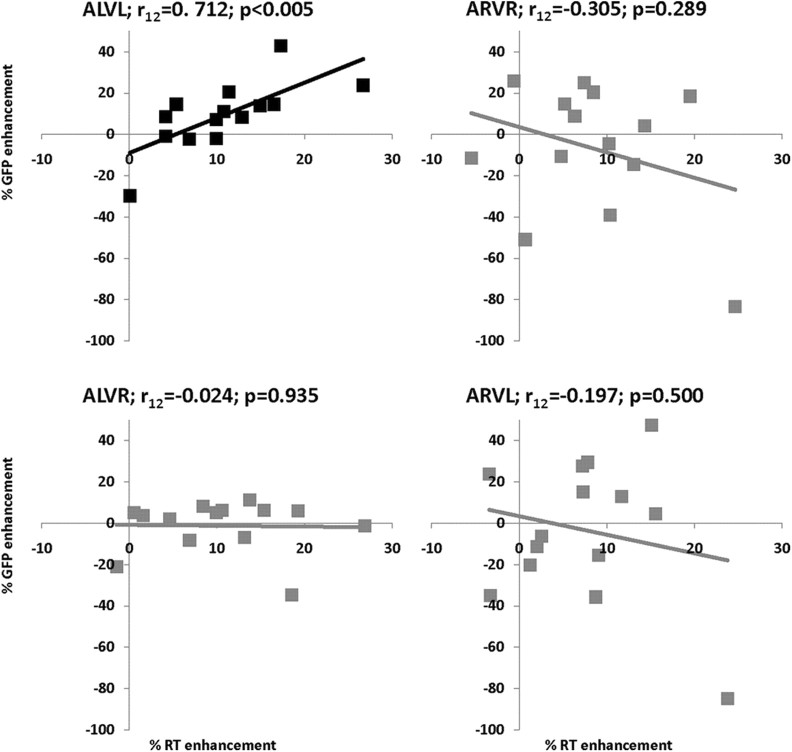
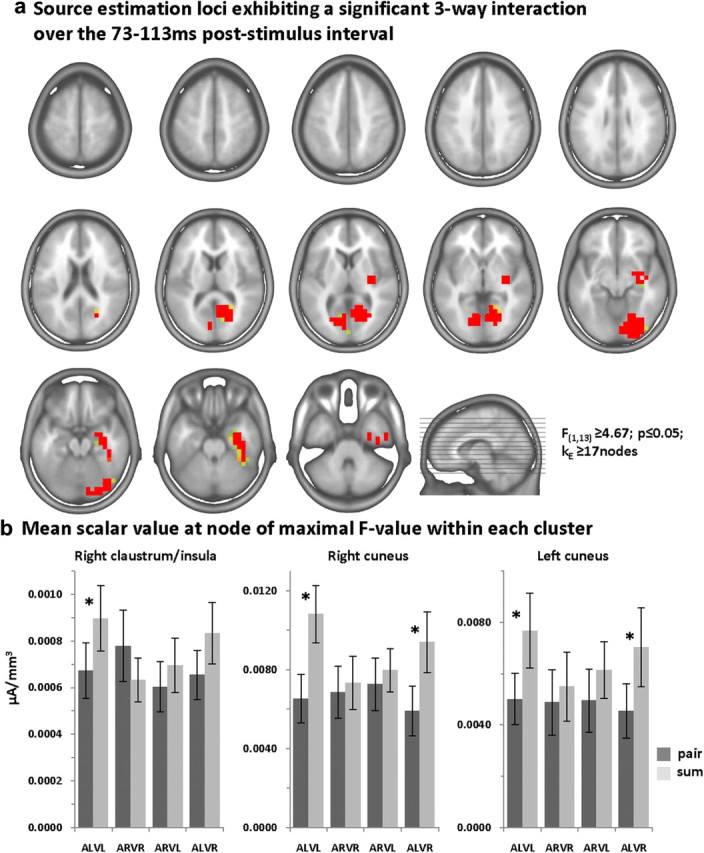
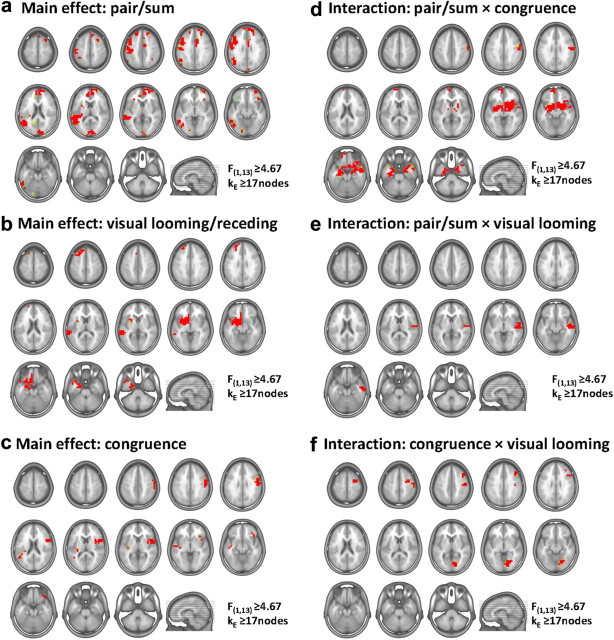
Multisensory interactions are a fundamental feature of brain organization. Principles governing multisensory processing have been established by varying stimulus location, timing and efficacy independently. Determining whether and how such principles operate when stimuli vary dynamically in their perceived distance (as when looming/receding) provides an assay for synergy among the above principles and also means for linking multisensory interactions between rudimentary stimuli with higher-order signals used for communication and motor planning. Human participants indicated movement of looming or receding versus static stimuli that were visual, auditory, or multisensory combinations while 160-channel EEG was recorded. Multivariate EEG analyses and distributed source estimations were performed. Nonlinear interactions between looming signals were observed at early poststimulus latencies (∼75 ms) in analyses of voltage waveforms, global field power, and source estimations. These looming-specific interactions positively correlated with reaction time facilitation, providing direct links between neural and performance metrics of multisensory integration. Statistical analyses of source estimations identified looming-specific interactions within the right claustrum/insula extending inferiorly into the amygdala and also within the bilateral cuneus extending into the inferior and lateral occipital cortices. Multisensory effects common to all conditions, regardless of perceived distance and congruity, followed (∼115 ms) and manifested as faster transition between temporally stable brain networks (vs summed responses to unisensory conditions). We demonstrate the early-latency, synergistic interplay between existing principles of multisensory interactions. Such findings change the manner in which to model multisensory interactions at neural and behavioral/perceptual levels. We also provide neurophysiologic backing for the notion that looming signals receive preferential treatment during perception.


Figures

Figure 1.
Figure 1.
Stimuli and paradigm. Participants performed a go/no-go detection of moving (looming, receding) versus static stimuli that could be auditory, visual, or multisensory auditory-visual. All the stimuli were initially of the same size/intensity to ensure that subjects used dynamic information to perform the task. The perception of movement was induced by linearly changing the size of the centrally displayed disk for the visual condition and by changing the intensity of the complex tone for the auditory condition. To control for differences in stimulus energy in the visual modality, opposite contrast polarities were used across blocks of trials.
Figure 2.
Figure 2.
Group-averaged (N = 14) voltage waveforms and ERP voltage waveform analyses. a, Data are displayed at a midline occipital electrode site (Oz) from the response to the multisensory pair (black traces), summed unisensory responses (red traces), and their difference (green traces). The arrow indicates modulations evident for multisensory looming conditions that were not apparent for any other multisensory combination over the ∼70–115 ms poststimulus interval. b, The area plots show results of applying millisecond-by-millisecond paired contrasts (t tests) across the 160 scalp electrodes comparing multisensory and the sum of unisensory stimuli. The number of electrodes showing a significant difference are plotted as a function of time (statistical criteria: p < 0.05 for a minimum of 11 consecutive milliseconds and 11 scalp sites). Nonlinear neural response interactions started at 68 ms poststimulus onset for multisensory looming stimuli (ALVL), at 119 ms for the multisensory receding (ARVR) condition, and at 95 and 140 ms for incongruent multisensory conditions ALVR and ARVL, respectively.
Figure 3.
Figure 3.
Topographic cluster analyses and single-subject fitting based on spatial correlation. a, The hierarchical clustering analysis was applied to the concatenated group-averaged ERPs from all pair and sum conditions (schematized by the gray box) and identified two template maps accounting for responses over the 73–145 ms poststimulus period that are shown on the right of this panel. b, The spatial correlation between each template map (Template maps 1 and 2) was calculated with the single-subject data from each condition, and the percentage of time a given template map yielded a higher spatial correlation was quantified (mean ± SEM shown) and submitted to ANOVA that revealed a significant interaction between pair versus sum conditions and template map. c, The latency when template map 1 was last observed (measured via spatial correlation) in the single-subject data from each condition was quantified and submitted to ANOVA. There was an earlier transition from template map 1 to template map 2 under multisensory versus summed unisensory conditions.
Figure 4.
Figure 4.
Global field power analyses. a, b, Modulations in response strength were identified using global field power (GFP), which was quantified over the 73–113 ms poststimulus period (a) and 114–145 ms poststimulus period (b) for each multisensory condition and the sum of unisensory conditions (dark and light gray bars, respectively). Mean ± SEM values are displayed, and asterisks indicate significant effects between specific pair and sum conditions. There was a significant three-way interaction over the 73–113 ms period, with evidence of selective nonlinear modulations for multisensory looming conditions. There was a significant main effect of pair versus sum conditions over the 114–145 ms period, indicative of generally stronger responses to multisensory versus summed unisensory conditions.
Figure 5.
Figure 5.
Relationship between RT and GFP multisensory enhancements. These scatter plots relate the percentage of RT enhancement to the percentage of GFP enhancement over the 73–113 ms period (x-axis and y-axis, respectively) for each of the multisensory conditions. The multisensory enhancement index is defined as the difference between the multisensory condition and the best unisensory condition divided by the best unisensory condition for each participant. A significant, positive, and linear correlation was exhibited only for the multisensory looming condition (ALVL).
Figure 6.
Figure 6.
Statistical analyses of source estimations: three-way interaction. Group-averaged source estimations were calculated over the 73–113 ms poststimulus period for each experimental condition and submitted to a three-way ANOVA. Regions exhibiting significant interactions between pair/sum conditions, congruent/incongruent multisensory pairs, and visual looming versus receding stimuli are shown in a on axial slices of the MNI template brain. Only nodes meeting the p ≤ 0.05 α criterion as well as a spatial extent criterion of at least 17 contiguous nodes were considered reliable (see Materials and Methods for details). Three clusters exhibited an interaction, and the mean scalar values (SEM indicated) from the node exhibiting the maximal F-value in each cluster are shown in b. Asterisks indicate significant differences between pair and sum conditions.
Figure 7.
Figure 7.
Statistical analyses of source estimations: main effects and two-way interactions. Group-averaged source estimations were calculated over the 73–113 ms poststimulus period for each experimental condition and submitted to a three-way ANOVA. Only nodes meeting the p ≤ 0.05 α criterion as well as a spatial extent criterion of at least 17 contiguous nodes were considered reliable (see Materials and Methods for details). Regions exhibiting significant main effects are shown in a–c on axial slices of the MNI template brain. Regions exhibiting significant two-way interactions are shown in d–f on axial slices of the MNI template brain.

References

    1. Bach DR, Schächinger H, Neuhoff JG, Esposito F, Di Salle F, Lehmann C, Herdener M, Scheffler K, Seifritz E. Rising sound intensity: an intrinsic warning cue activating the amygdala. Cereb Cortex. 2008;18:145–150. - PubMed
    1. Beer AL, Plank T, Greenlee MW. Diffusion tensor imaging shows white matter tracts between human auditory and visual cortex. Exp Brain Res. 2011;213:200–308. - PubMed
    1. Besle J, Fort A, Giard MH. Interest and validity of the additive model in electrophysiological studies of multisensory interactions. Cogn Process. 2004;5:189–192.
    1. Besle J, Fischer C, Bidet-Caulet A, Lecaignard F, Bertrand O, Giard MH. Visual activation and audiovisual interactions in the auditory cortex during speech perception: intracranial recordings in humans. J Neurosci. 2008;28:14301–14310. - PMC - PubMed
    1. Bizley JK, Nodal FR, Bajo VM, Nelken I, King AJ. Physiological and anatomical evidence for multisensory interactions in auditory cortex. Cereb Cortex. 2007;17:2172–2189. - PMC - PubMed

Publication types