Comparative Study
. 2012 Jan 25;32(4):1336-52.
doi: 10.1523/JNEUROSCI.4346-11.2012.

The α1K276E startle disease mutation reveals multiple intermediate states in the gating of glycine receptors

Affiliations
Comparative Study

The α1K276E startle disease mutation reveals multiple intermediate states in the gating of glycine receptors

Remigijus Lape et al. J Neurosci. .

Abstract

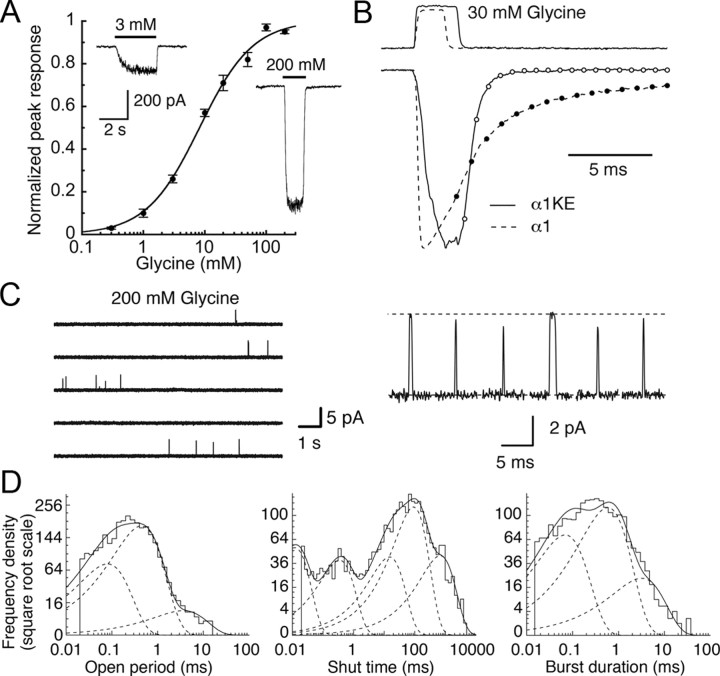
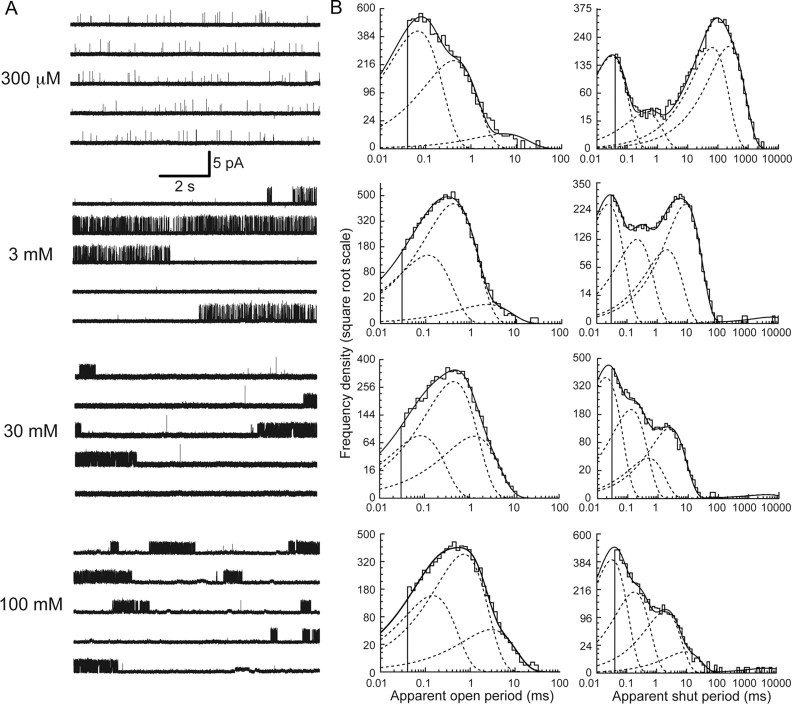
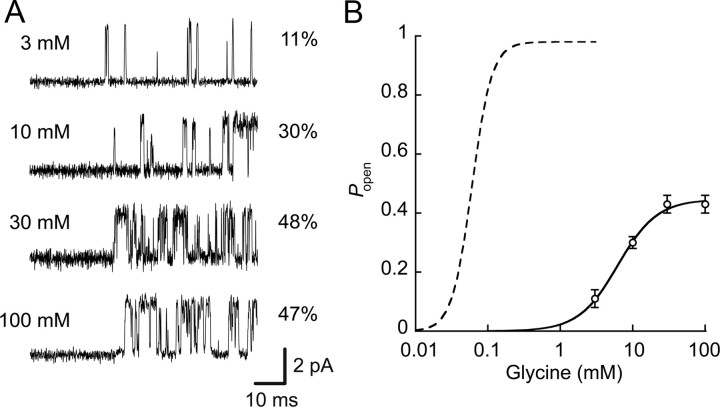
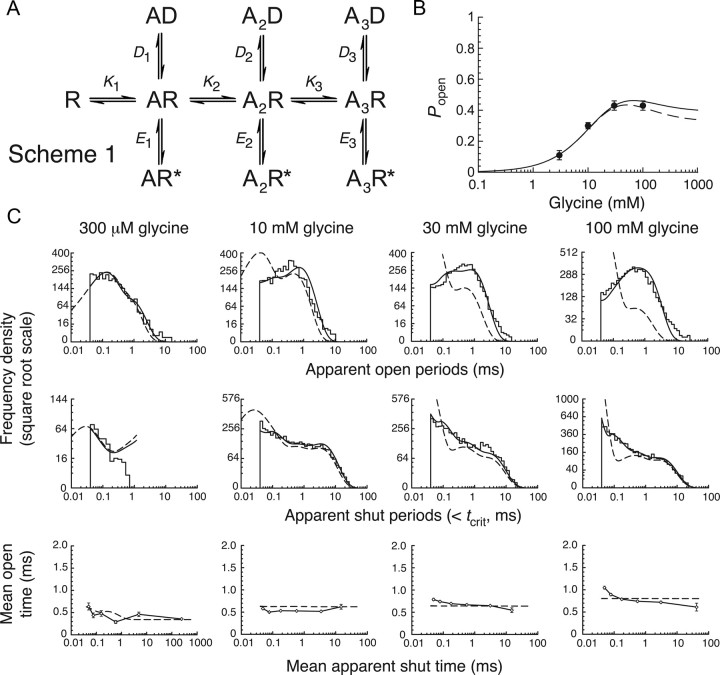
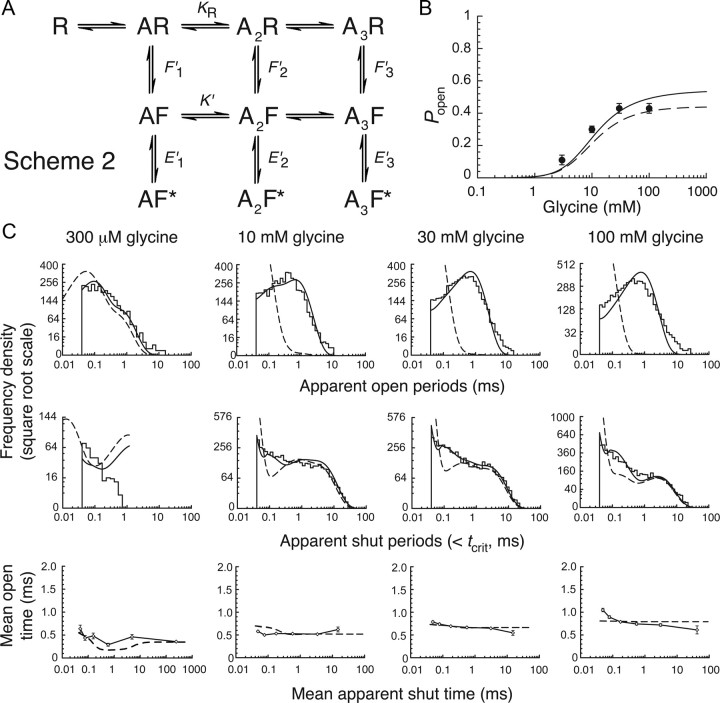
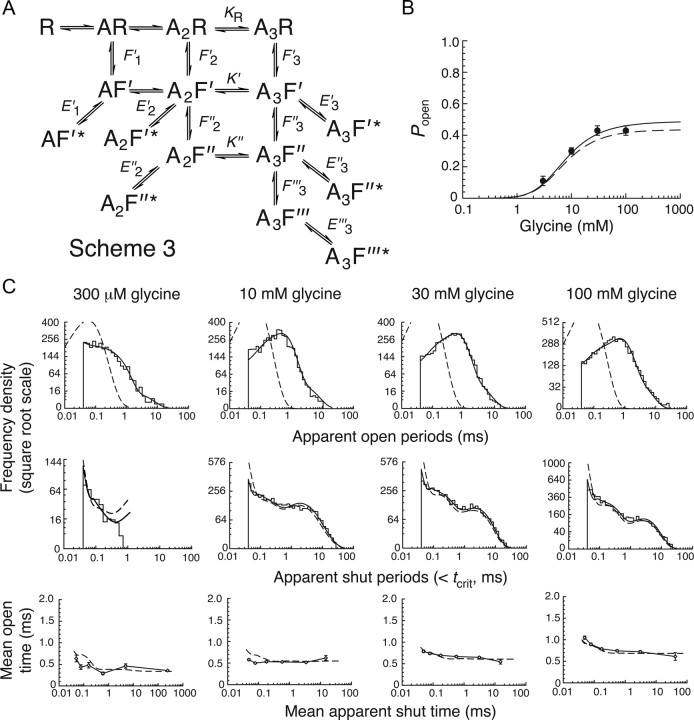
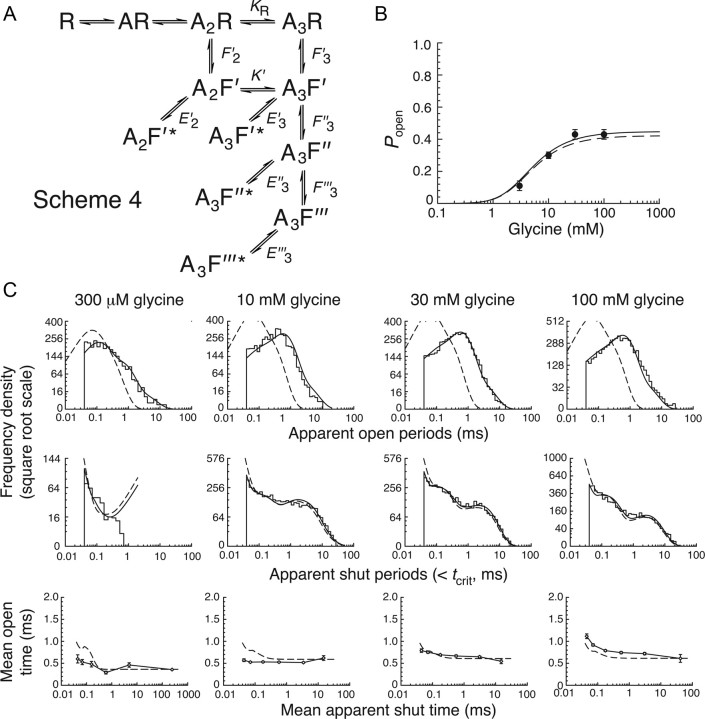
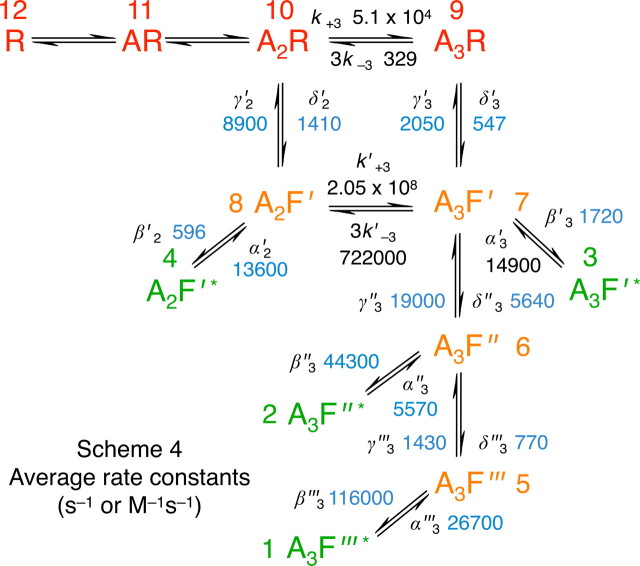
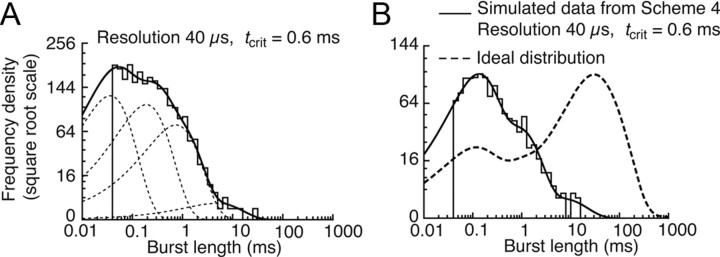
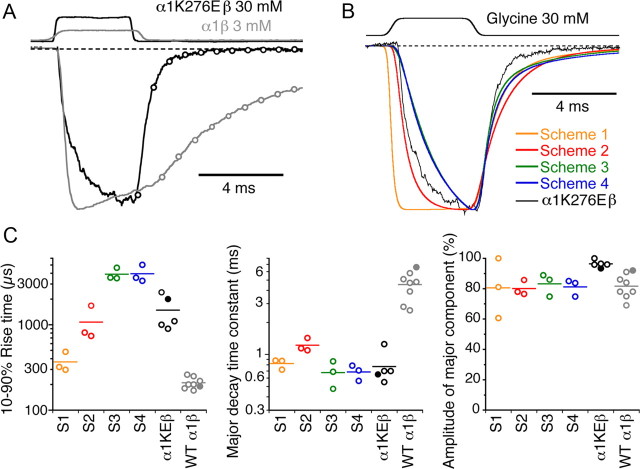
Loss-of-function mutations in human glycine receptors cause hyperekplexia, a rare inherited disease associated with an exaggerated startle response. We have studied a human disease mutation in the M2-M3 loop of the glycine receptor α1 subunit (K276E) using direct fitting of mechanisms to single-channel recordings with the program HJCFIT. Whole-cell recordings from HEK293 cells showed the mutation reduced the receptor glycine sensitivity. In single-channel recordings, rat homomeric α1 K276E receptors were barely active, even at 200 mM glycine. Coexpression of the β subunit partially rescued channel function. Heteromeric mutant channels opened in brief bursts at 300 μM glycine (a concentration that is near-maximal for wild type) and reached a maximum one-channel open probability of about 45% at 100 mm glycine (compared to 96% for wild type). Distributions of apparent open times contained more than one component in high glycine and, therefore, could not be described by mechanisms with only one fully liganded open state. Fits to the data were much better with mechanisms in which opening can also occur from more than one fully liganded intermediate (e.g., "primed" models). Brief pulses of glycine (∼3 ms, 30 mM) applied to mutant channels in outside-out patches activated currents with a slower rise time (1.5 ms) than those of wild-type channels (0.2 ms) and a much faster decay. These features were predicted reasonably well by the mechanisms obtained from fitting single-channel data. Our results show that, by slowing and impairing channel gating, the K276E mutation facilitates the detection of closed reaction intermediates in the activation pathway of glycine channels.


Figures

Figure 1.
Figure 1.
The properties of α1 K276E homomeric glycine receptors. A, The concentration–response relation for α1K276E homomeric glycine receptors. Points represent average data for n = 8 cells. The line is the fit of the Hill equation to the data (EC50 = 8.2 ± 0.9 mm, two-unit likelihood interval 6.4–9.4 mm; nH = 1.04 ± 0.03, two-unit likelihood interval 0.96–1.13). Sensitivity to glycine is greatly reduced compared with wild-type homomeric receptors, which have an EC50 of 78.8 μm (Beato et al., 2002). Insets show representative whole-cell currents. B, Outside-out patch recordings of nonequilibrium responses of wild-type and α1K276E homomeric receptors to 30 mm glycine jumps. The decay of wild-type responses was fitted with two exponential components (filled circles, τ1 = 1.9 ms, 69%, τ2 = 13 ms). The decay of the mutant responses was much faster and well fitted with a single component (open circles, τ = 642 μs). C, Equilibrium single-channel recordings of α1K276E homomeric glycine receptors. Activations were sparse at a range of concentrations from 10 to 200 mm glycine, and no clustering was observed. Openings were brief, with mean amplitude of 5.1 ± 0.2 pA (n = 10 patches) at a nominal holding potential of −80 mV. Many openings were shorter than the rise time of the filter, as shown also by the examples of individual activations at 200 mm glycine in the right panel. D, Dwell-time distributions at 200 mm glycine. The open period distribution (left) was fitted with three components (dashed lines): τ1 = 79 μs (29%), τ2 = 430 μs (68%), and τ3 = 3.5 ms (3%). The shut time distribution (middle) was fitted with a mixture of five exponential components: τ1 = 12 μs (18%), τ2 = 340 μs (13%), τ3 = 15 ms (15%), τ4 = 89 ms (39%), and τ5 = 666 ms (15%). In general, few short shuttings were detected, and the distributions of open and shut periods exhibited little concentration dependence. To plot burst durations (right) and count the number of openings per burst, the record was divided into bursts by using a critical shut time duration of 3 ms. The burst duration distribution was fitted with a mixture of three exponential densities [τ1 = 70 μs (34%), τ2 = 590 μs (55%), and τ3 = 3.2 ms (11%)].
Figure 2.
Figure 2.
Empirical fits to single-channel recordings of α1K276Eβ heteromeric glycine receptors. A, Continuous runs of 50 s of representative α1K276Eβ heteromeric glycine receptor activity at several glycine concentrations. At the lowest concentration where activations were observed (300 μm glycine), most events were isolated single openings. At concentrations of glycine of 3 mm and above, activations were grouped into clusters separated by long (1–100 s) quiescent periods. The clusters were shorter at higher concentrations. Data were filtered at 3–5 kHz. A discharge of the amplifier feedback capacitor can be seen in the intercluster gaps in each of the first four traces for the 30 mm patch. In the 100 mm patch shown here, the very low baseline noise level (about 150 fA at 5 kHz) revealed sporadic activations of a slow channel, presumably endogenous to HEK293 cells, with a conductance of ∼500 fS, which was occasionally seen in other records. B, Distributions of idealized single-channel open and shut periods were fitted with mixed exponential densities. Components are shown with dotted lines (see Tables 1 and 2 for average values). Three components were used for open times at every concentration. Five components were used for shut times. At the lowest concentration of glycine (300 μm), two components described the shut times that divided bursts (that is, those longer than the critical time, 0.6 ms). At all other concentrations, four components described the majority of shuttings within clusters, and the fifth component loosely fitted the long desensitized sojourns between clusters. Note that, with increasing concentration, apparent open times lengthen and apparent shut times shorten. However, unlike wild-type receptors, the longer intracluster shut times remain, even at the highest concentration (100 mm glycine).
Figure 3.
Figure 3.
The probability of a channel being open during clusters of the α1K276Eβ heteromeric glycine receptor activations. A, Representative activations from the initial segment of a cluster for the range of concentrations used to construct the Popen curve. The open probability for the cluster is indicated in the right column. At higher concentrations, longer groups of openings appear but a complex mixture of shut times (up to about 10 ms) are present at all concentrations. B, Cluster open probability was plotted against glycine concentration (open circles; 2–4 patches, 11–73 clusters per point). The maximum open probability obtained from the fitted Hill equation (solid line) was 45 ± 3%, much less than for wild-type homomeric or heteromeric glycine receptors containing the α1 subunit. The EC50 was 6.2 ± 0.9 mm, and Hill slope was 1.6 ± 0.4. Wild-type heteromeric receptor open probability [dashed line, shown here for comparison, as calculated in Burzomato et al. (2004)] reached a maximum of 97%, with EC50 of 0.06 mm and Hill slope of 3.4.
Figure 4.
Figure 4.
Fits of a mechanism with distal shut states to the α1K276Eβ heteromeric receptor single-channel data. A, Scheme 1 represents a receptor with three binding sites and three open states (indicated by asterisks) directly connected to the monoliganded, diliganded, and fully liganded resting shut states. Directly connected to the resting bound shut states are short-lived shut states. Fits with this mechanism were done assuming that the binding sites were not independent. Thus, all rate constants in these fits were free parameters (18 in total). B, The solid line is the Popen curve calculated from the values of the rate constants fitted to this set and taking missed events into account. Data points are cluster open probabilities as in Figure 3B. The dashed line is the predicted Popen curve at ideal resolution. C, The results of Scheme 1 fit to a dataset containing four single-channel records. The histograms are the experimental open (top row) and shut (middle row) period distributions. The continuous curves are the distributions predicted from the fitted rate constants (taking missed events into account). The dashed lines are calculated from the same rate constant values and are the predicted distributions expected for a perfect experimental resolution [no missed events; Eqs. 3.64 and 3.90 in Colquhoun and Hawkes (1982), for open and shut times, respectively]. The bottom row plots show the open–shut time correlations in the records of this set (circles with error bars and connecting lines) and the predictions for these correlations (dashed lines) calculated from the fitted rate constants.
Figure 5.
Figure 5.
Fits of a flip mechanism to the heteromeric mutant receptor single-channel data. A, Scheme 2 is a flip mechanism with three binding sites and three open states (indicated by asterisks), which can be accessed from resting liganded states through extra shut (“flipped”) states. After imposing the constraints of binding site independence and microscopic reversibility, this mechanism had 14 free parameters. Average rate constants are given in Table 4. B, C, The results of Scheme 2 fitted to the same dataset as in Figure 4. For the details, see Figure 4. Note that open period distributions were not predicted well with the flip mechanism.
Figure 6.
Figure 6.
Fits of a primed mechanism to the heteromeric mutant receptor single-channel data. A, Scheme 3 is a primed mechanism adapted from Mukhtasimova et al. (2009). Six open states (asterisks) can be accessed from an array of different ligation and different level of primed shut states. This mechanism has 27 free parameters after imposing constraints similar to those for Scheme 2. B, C, The results of Scheme 3 fit to the same dataset as in Figures 4 and 5. For the details, see Figure 4. Note that the predictions of the open period distributions, the shut time distributions, and the correlation plots were very good at all concentrations. The Popen curve was also predicted well. Average rate constants are given in Table 4.
Figure 7.
Figure 7.
Fits of a reduced primed mechanism to the heteromeric mutant receptor single-channel data. A, Scheme 4 is a subset of the primed mechanism. To obtain it, states with low occupancy were removed from Scheme 3. For fitting, constraints similar to those used for Scheme 2 were imposed. As a consequence, the reduced primed mechanism has 19 free parameters, fewer than those for the full primed mechanism. B, C, The results of Scheme 4 fit to the same dataset as in Figures 4, 5, and 6. For the details, see Figure 4. The fits of Scheme 4 were almost as good as with Scheme 3 despite many fewer free parameters. Table 4 gives average rate constants.
Figure 8.
Figure 8.
The reduced primed mechanism (Scheme 4), the fitting of which is exemplified in Figure 7. Each state is numbered for easy reference in the text. States 1–4, in green and with asterisk, are open; states 5–12 are shut. The primed states are orange and the resting states are in red. The name of each rate constant is shown with the mean of three estimates of each rate constant (Table 4). Macroscopic rates are shown; for example, the rate of dissociation from a single binding site in the primed state is 241,000 s−1. Mean rates in blue have a coefficient of variation <33%. The cyclic structure obeyed microscopic reversibility for each individual fit but the effect of averaging means that it appears not to be obeyed with the mean rates marked here. The mean equilibrium constants for each transition are given in Table 4.
Figure 9.
Figure 9.
Comparison of empirical and predicted burst length distributions. A, The experimentally determined distribution of bursts at 300 μm (tcrit = 0.6 ms, resolution 40 μs) was fit with four exponential components: τ1 = 36 μs (area 40.6%); τ2 = 190 μs (35%); τ3 = 740 μs (23.7%); and τ4 = 4.6 ms (0.7%). In the four patches analyzed, average time constants were 38 ± 2 μs (relative area 45 ± 3%), 230 ± 40 μs (35 ± 1%), 0.9 ± 0.2 ms (19 ± 3%), and 13 ± 8 ms (0.7 ± 2%). B, Scheme 4 predicted a burst length distribution with ideal time resolution with a predominant slow component (dashed line). When the same resolution and tcrit were imposed on data-simulated receptor activity from the same scheme, the distribution was fit with three components and was remarkably similar to the experimental distribution in A: τ1 = 120 μs (area 68.1%), τ2 = 810 μs (30.5%), and τ3 = 6.2 ms (1.5%).
Figure 10.
Figure 10.
Comparison of empirical and predicted concentration jumps. A, The rise time of wild-type α1β glycine receptor response to 3 mm glycine is extremely fast (lower gray trace, 10–90% rise time of 190 μs for the trace shown). The decay of the response after the end of the pulse was much slower, and well fitted by three exponential components [open gray circles, τ1 = 6.6 ms (amplitude 92%), τ2 = 30 ms (7%), and τ3 = 149 ms (1%) for this record]. The rising phase of the response of α1KEβ receptors (lower black trace) to a ∼4 ms pulse of 30 mm glycine was, on average, sevenfold slower than wild type. In multiple patches, the response apparently failed to peak during a ∼3 ms pulse, but in other patches, the responses were faster. The decay of the α1KEβ current following the removal of glycine was rapid, and well described by a double exponential function. The patch shown here was fit with time constants of 0.65 ms (94%) and 3.9 ms. The upper traces show the solution exchanges measured at the open tip at the end of each experiment (black for K276E, gray for wild type). B, Superimposition of a representative experimental current trace (black) with predicted responses to a 4 ms pulse of 30 mm glycine from the four mechanisms fitted to single-channel data. The predicted traces are the averages of the responses calculated from each set of fitted rate constants. Calculated responses were normalized to the peak before averaging. Scheme 1 (orange trace) predicts a much faster rise time than observed for experimental jumps. Scheme 2 (red trace) predicts a slightly faster rise time. Both Schemes 3 and 4 (green and blue traces, respectively) predicted slow-rising phases that failed to peak during the 4 ms pulse. C, Dot plots summarizing the 10–90% rise times and the major decay time constant (τ1) and its amplitude (A1) for responses calculated from the fitted mechanisms and experimental jumps (color coding as in B, wild-type values in gray). The values for each fitted dataset are shown, and the mean is indicated as a bar. In experimental jumps on the K276E mutant (black symbols), only a very small slow component of the decay was detected. For all the mechanisms tested, this slow component was predicted to have, on average, about 20% of the total amplitude. Filled circles represent the values for the experimental traces plotted in A and B.

Similar articles

Cited by

References

    1. Auerbach A. The gating isomerization of acetylcholine receptors. J Physiol. 2010;588:573–586. - PMC - PubMed
    1. Ball FG, Sansom MS. Single-channel autocorrelation functions: the effects of time interval omission. Biophys J. 1988;53:819–832. - PMC - PubMed
    1. Ball FG, Milne RK, Yeo GF. Marked continuous-time Markov chain modelling of burst behaviour for single ion channels. J Appl Math Decis Sci. 2007;2007 doi: 10.1155/2007/48138. - DOI
    1. Beato M. The time course of transmitter at glycinergic synapses onto motoneurons. J Neurosci. 2008;28:7412–7425. - PMC - PubMed
    1. Beato M, Groot-Kormelink PJ, Colquhoun D, Sivilotti LG. Openings of the rat recombinant α1 homomeric glycine receptor as a function of the number of agonist molecules bound. J Gen Physiol. 2002;119:443–466. - PMC - PubMed

Publication types

LinkOut - more resources