Comparative Study
. 2012 Jan 25;32(4):1395-407.
doi: 10.1523/JNEUROSCI.3985-11.2012.

The amplitude and timing of the BOLD signal reflects the relationship between local field potential power at different frequencies

Affiliations
Comparative Study

The amplitude and timing of the BOLD signal reflects the relationship between local field potential power at different frequencies

Cesare Magri et al. J Neurosci. .

Abstract

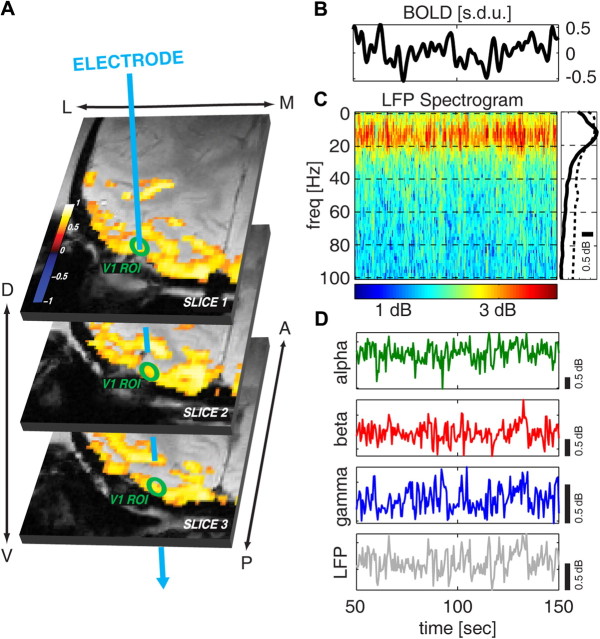
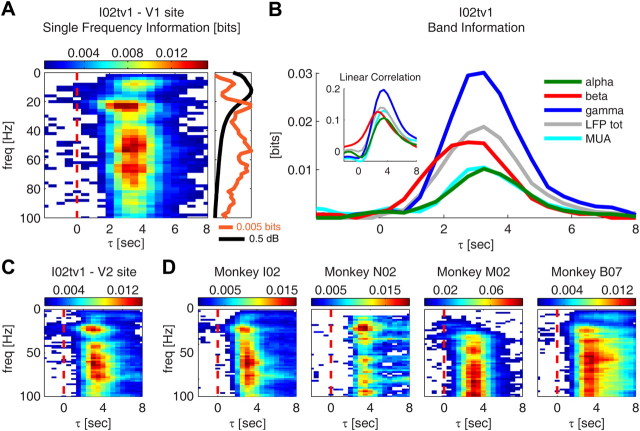
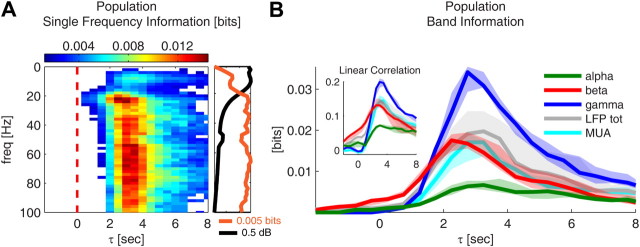
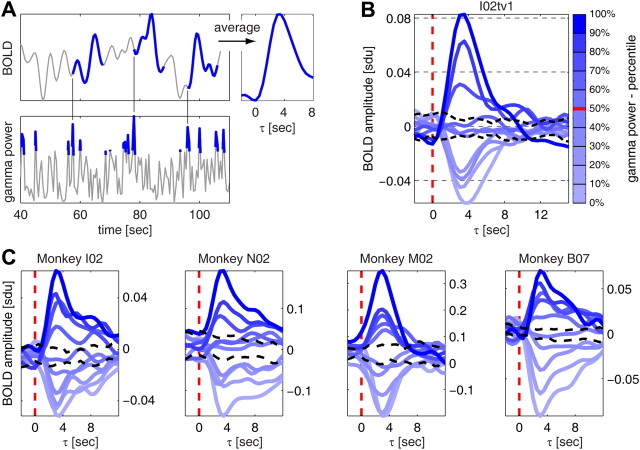
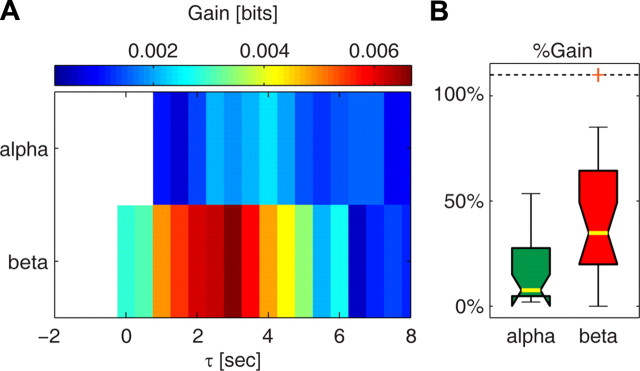
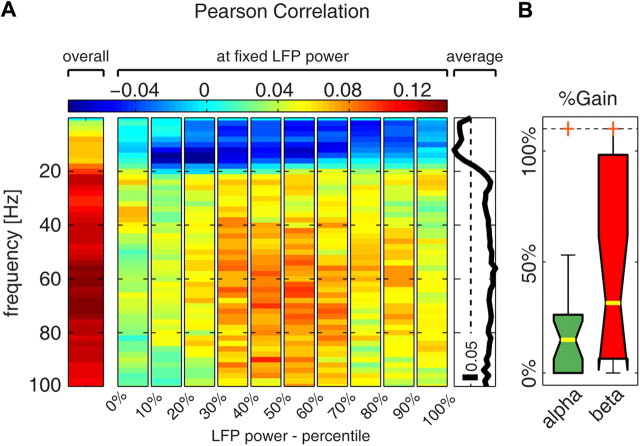
There is growing evidence that several components of the mass neural activity contributing to the local field potential (LFP) can be partly separated by decomposing the LFP into nonoverlapping frequency bands. Although the blood oxygen level-dependent (BOLD) signal has been found to correlate preferentially with specific frequency bands of the LFP, it is still unclear whether the BOLD signal relates to the activity expressed by each LFP band independently of the others or if, instead, it also reflects specific relationships among different bands. We investigated these issues by recording, simultaneously and with high spatiotemporal resolution, BOLD signal and LFP during spontaneous activity in early visual cortices of anesthetized monkeys (Macaca mulatta). We used information theory to characterize the statistical dependency between BOLD and LFP. We found that the alpha (8-12 Hz), beta (18-30 Hz), and gamma (40-100 Hz) LFP bands were informative about the BOLD signal. In agreement with previous studies, gamma was the most informative band. Both increases and decreases in BOLD signal reliably followed increases and decreases in gamma power. However, both alpha and beta power signals carried information about BOLD that was largely complementary to that carried by gamma power. In particular, the relationship between alpha and gamma power was reflected in the amplitude of the BOLD signal, while the relationship between beta and gamma bands was reflected in the latency of BOLD with respect to significant changes in gamma power. These results lay the basis for identifying contributions of different neural pathways to cortical processing using fMRI.


Figures

Figure 1.
Figure 1.
Example of combined electrophysiological and BOLD fMRI recording and illustration of the spectral properties of the LFP. A, Functional BOLD activation maps, superimposed on the anatomical scans, in response to a high-contrast (100%), full-field, rotating polar checkerboard presented to both eyes. The activation maps are shown as the correlation coefficients (p < 0.0001, t test, uncorrected for multiple comparisons) between the BOLD signal and a boxcar model of the stimulus sequence convolved with a canonical hemodynamic response function. The green circles indicate a schematic ROI located in V1. The blue arrow indicates, for each slice, the approximate position of the multichannel electrode. B, Example BOLD signal time course, averaged over an ROI located in V1, during spontaneous activity. Only 100 s are shown. C, Spectrogram of the LFPs recorded in V1 simultaneously with the BOLD signal shown in B. The average spectrum over the plotted period is shown on the right as a solid black line. The dashed line illustrates the average spectrum computed using data from all sessions. D, Time course of the spontaneous LFP power in the alpha, beta, and gamma bands (green, red, and blue lines, respectively) and total LFP power (gray line).
Figure 2.
Figure 2.
Information about the BOLD signal conveyed by LFP power at different frequencies. A, Mutual information between the BOLD signal and LFP power at different frequencies for different lags τ between the two signals (τ > 0 indicates that the BOLD signal has been shifted back with respect to the neural response). Results are shown for a representative session (I02tv1). Only significant (p < 0.05, bootstrap test, uncorrected for multiple comparisons) information values are colored. On the right, the information values are plotted only for lag τ = 3 s (orange line). The average spectrum of the LFPs recorded during the session is also shown (black line). B, Mutual information between the BOLD signal and the LFP power in selected frequency bands and between the BOLD signal and MUA (same session as in A). The following four LFP bands are considered: alpha ([8–12 Hz], green line); beta ([18–30 Hz], red line); gamma ([40–100 Hz], blue line); the total LFP power ([0–100 Hz], gray line); and MUA is computed as the power of the electrophysiological signal between 900 and 3000 Hz (cyan line). The inset shows the Pearson correlation between the BOLD signal and the power in the LFP bands, and between the BOLD signal and MUA. C, Same plot as in A for a V2 recording site of session I02tv1. D, Same plot as in A for four additional sessions. One additional session is shown for monkey I02, while one representative session is shown for each of the other monkeys.
Figure 3.
Figure 3.
Session summary of the information results. All results are shown as median over all sessions. A, Mutual information between BOLD signal and LFP power at different frequencies for different lags τ between the two signals (τ > 0 indicates that the BOLD signal has been shifted back with respect to the neural response). Only significant (p < 0.0001, bootstrap test, uncorrected for multiple comparisons) information values are colored. On the right, the information values are plotted only for lag τ = 3 s (orange line). The average spectrum of the LFPs is also shown (black line). B, Mutual information between the BOLD signal and the LFP power in selected frequency bands, and between the BOLD signal and MUA. The following four LFP bands are considered: alpha ([8–12 Hz], green line); beta ([18–30 Hz], red line); gamma ([40–100 Hz], blue line); and the total LFP power ([0–100 Hz], gray line); and MUA is computed as the power of the electrophysiological signal between 900 and 3000 Hz (cyan line). The inset shows the Pearson correlation between the BOLD signal and different LFP bands, and between the BOLD signal and MUA. Solid lines indicate the median over all sessions, and shaded areas indicate the range between the 40th and 60th percentile.
Figure 4.
Figure 4.
The amplitude of the BOLD signal scales with gamma power. A, Illustration of the procedure for computing average changes in the BOLD signal following different intensities of gamma power. Data are from session I02tv1. Left, The top 10% gamma power data points and the BOLD signal in the 15 s following three of the detected high-gamma power events are highlighted in blue. Right, Average change in BOLD signal following the top 10% gamma power data points. B, Average changes in BOLD signal for each of the 10 percentile levels of gamma power (same data as in A). The significance levels (black dashed lines) were computed as the fifth and 95th percentile of the distribution of changes in BOLD signal following sets of randomly selected data points (the number of points in each random set being equal to the number of points in each of the 10 gamma percentile levels). C, Average changes in BOLD signal (same type of plot as in B) for four additional sessions. One representative session is shown for each monkey.
Figure 5.
Figure 5.
The information gain yielded by alpha and beta power. A, Gain in the information about the BOLD signal yielded by alpha power and beta power over the information conveyed by gamma power alone. Results are plotted as the median over all sessions. Only significant (p < 0.05, bootstrap test, uncorrected for multiple comparisons) information values are colored. The highest information gain was found for beta power between 1.5 and 3.5 s. The information for alpha power was maximal between 2.5 and 4.5 s. B, Percentage information gain yielded by alpha and beta power over gamma power. For each band, information values were averaged over the range of lags for which the information gain (A) was maximal. Results are plotted as median (yellow bar) and interquartile range (box). The whiskers extend to the most extreme data points not considered outliers, and outliers are plotted as orange crosses (outliers outside the range 0–110% are moved to these limits). The power in the beta and alpha bands yielded ∼30% and 7% additional information over the information conveyed by gamma power alone, respectively.
Figure 6.
Figure 6.
Mechanisms of the complementarity between gamma and beta power. A, Illustration of the procedure for computing average changes in BOLD signal following different intensities of beta power at fixed gamma power. Data are from session I02tv1. Gamma power data points corresponding to the top 33% gamma power intensities are marked in blue. Beta power values during these epochs of high gamma power are subdivided into three equally populated levels of increasing intensity highlighted with three shades of red (lighter red corresponds to lower beta intensities). Changes in BOLD signal in the 15 s following detected beta power data points are indicated using the same color convention as for beta power. Only three BOLD segments are shown for simplicity, one segment for each level of beta power. B, Average changes in BOLD signal following each of the three levels of beta power at fixed gamma power. Same data as in A. Results are shown for each of the three fixed gamma levels (top, middle, and lowest 33%). The insets show a detail of the average BOLD curves between 1.5 and 3.5 s. C, Same plot as in B, top, but for the average BOLD changes computed using alpha power (green), gamma power (blue), and the total LFP (0–100 Hz) power (gray) instead of beta power. D, Distribution of the shift of rising time between neighboring levels of beta power (see main text). Box plots are shown also for the alpha, gamma, total LFP power, and the difference, LFP–beta, between the total LFP power and the beta band. Results are plotted as median (yellow bar) and interquartile range (box). The whiskers extend to the most extreme data points not considered outliers, and outliers are plotted as orange crosses. Bands for which the distribution of the rising time was significantly negative (p < 0.05, Wilcoxon signed rank test) are highlighted in gray. The top (bottom) plot shows the shifts in rising time of the BOLD responses following the top (lowest) 33% of gamma power events. Negative (positive) shifts in rising time mean anticipation (delay) of the variations in the BOLD signal following the high (low) gamma power event.
Figure 7.
Figure 7.
Alpha power and the BOLD signal anticorrelate at fixed LFP power. A, Pearson correlation between the power at single LFP frequencies and the BOLD signal delayed by 3.5 s with respect to the electrophysiology. The left plot shows the overall correlation coefficient computed across all data points. The middle plot shows the Pearson correlation computed only across data points belonging to the LFP power percentile indicated on the x-axis (we call this “correlation at fixed LFP power”). The right plot shows the average of the Pearson correlation at fixed LFP power over all LFP percentile levels. B, Percentage information gain yielded by alpha and beta power over the information conveyed by gamma power at fixed total LFP power (gain values were averaged over the 10 percentile levels in which the total LFP power was subdivided). Results are plotted as median (yellow bar) and interquartile range (box). The whiskers extend to the most extreme data points not considered outliers, and outliers are plotted as orange crosses (outliers outside the range 0–110% are moved to these limits).

Similar articles

Cited by

References

    1. Basar E. EEG-brain dynamics: relation between EEG and brain evoked potentials. Amsterdam: Elsevier-North-Holland Biomedical; 1980.
    1. Belitski A, Gretton A, Magri C, Murayama Y, Montemurro MA, Logothetis NK, Panzeri S. Low-frequency local field potentials and spikes in primary visual cortex convey independent visual information. J Neurosci. 2008;28:5696–5709. - PMC - PubMed
    1. Brown GG, Perthen JE, Liu TT, Buxton RB. A primer on functional magnetic resonance imaging. Neuropsychol Rev. 2007;17:107–125. - PubMed
    1. Brunel N, Wang XJ. What determines the frequency of fast network oscillations with irregular neural discharges? I. Synaptic dynamics and excitation-inhibition balance. J Neurophysiol. 2003;90:415–430. - PubMed
    1. Constantinople CM, Bruno RM. Effects and mechanisms of wakefulness on local cortical networks. Neuron. 2011;69:1061–1068. - PMC - PubMed

Publication types