

Effective Connectivity Modeling for fMRI: Six Issues and Possible Solutions Using Linear Dynamic Systems
- PMID: 22279430
- PMCID: PMC3260563
- DOI: 10.3389/fnsys.2011.00104
Effective Connectivity Modeling for fMRI: Six Issues and Possible Solutions Using Linear Dynamic Systems
Abstract
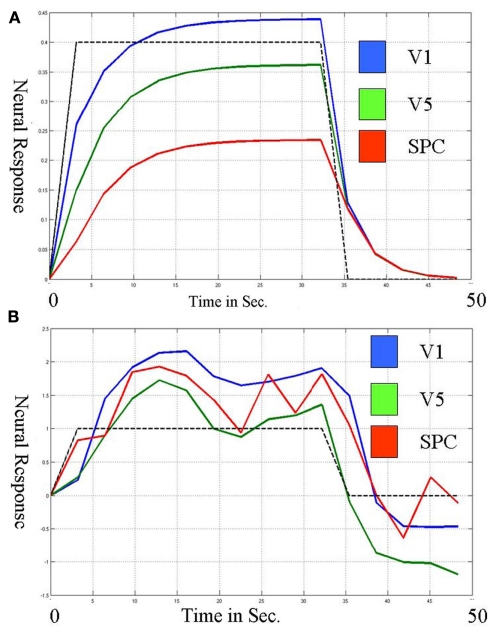
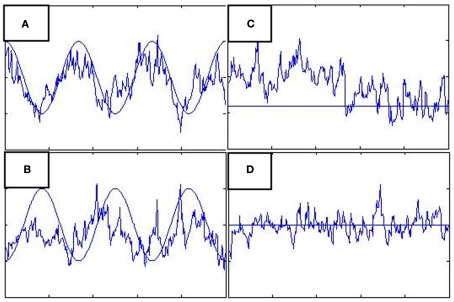
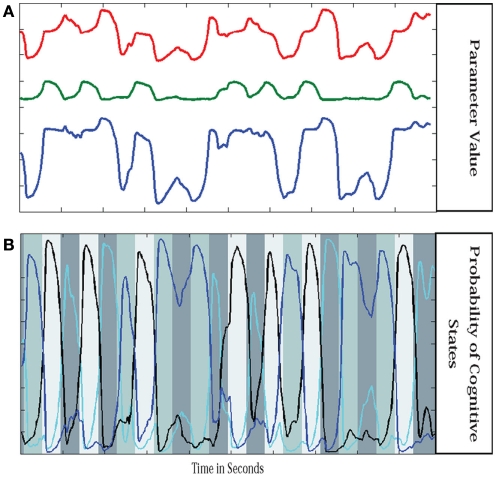
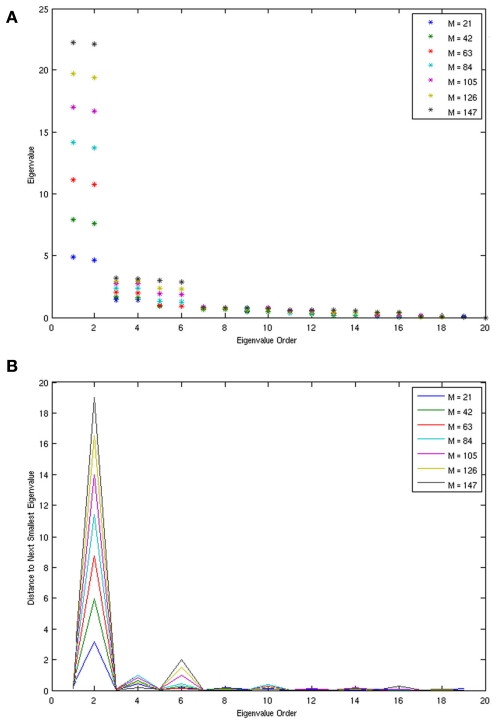
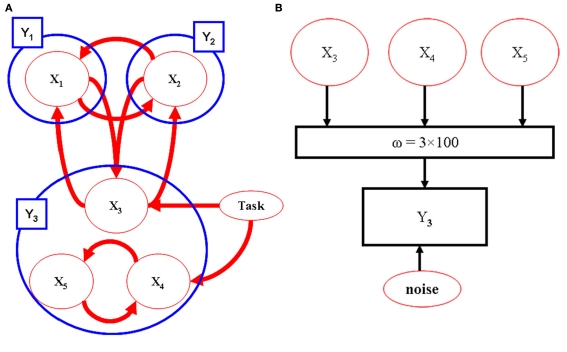
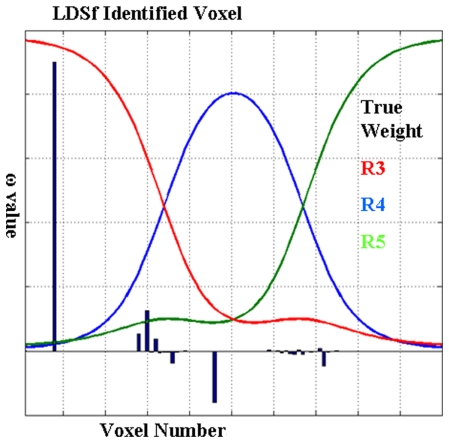
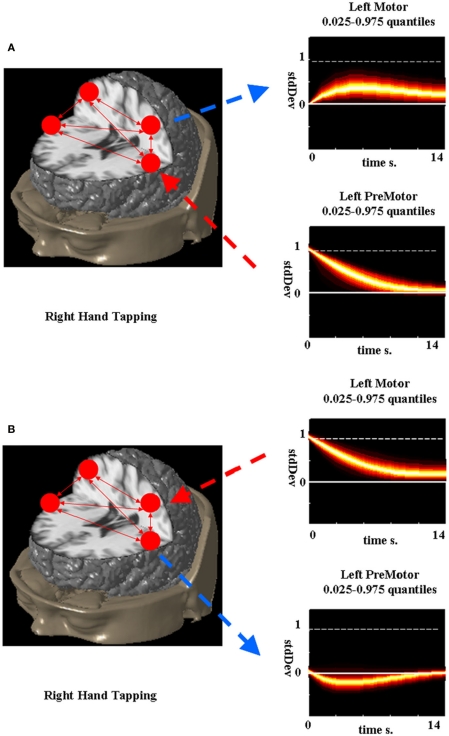
Analysis of directionally specific or causal interactions between regions in functional magnetic resonance imaging (fMRI) data has proliferated. Here we identify six issues with existing effective connectivity methods that need to be addressed. The issues are discussed within the framework of linear dynamic systems for fMRI (LDSf). The first concerns the use of deterministic models to identify inter-regional effective connectivity. We show that deterministic dynamics are incapable of identifying the trial-to-trial variability typically investigated as the marker of connectivity while stochastic models can capture this variability. The second concerns the simplistic (constant) connectivity modeled by most methods. Connectivity parameters of the LDSf model can vary at the same timescale as the input data. Further, extending LDSf to mixtures of multiple models provides more robust connectivity variation. The third concerns the correct identification of the network itself including the number and anatomical origin of the network nodes. Augmentation of the LDSf state space can identify additional nodes of a network. The fourth concerns the locus of the signal used as a "node" in a network. A novel extension LDSf incorporating sparse canonical correlations can select most relevant voxels from an anatomically defined region based on connectivity. The fifth concerns connection interpretation. Individual parameter differences have received most attention. We present alternative network descriptors of connectivity changes which consider the whole network. The sixth concerns the temporal resolution of fMRI data relative to the timescale of the inter-regional interactions in the brain. LDSf includes an "instantaneous" connection term to capture connectivity occurring at timescales faster than the data resolution. The LDS framework can also be extended to statistically combine fMRI and EEG data. The LDSf framework is a promising foundation for effective connectivity analysis.
Keywords: dynamic systems; effective connectivity; fMRI.
Figures
Similar articles
-
Fusing concurrent EEG-fMRI with dynamic causal modeling: application to effective connectivity during face perception.Neuroimage. 2014 Nov 15;102 Pt 1:60-70. doi: 10.1016/j.neuroimage.2013.06.083. Epub 2013 Jul 9. Neuroimage. 2014. PMID: 23850464 Review.
-
Constructing fMRI connectivity networks: a whole brain functional parcellation method for node definition.J Neurosci Methods. 2014 May 15;228:86-99. doi: 10.1016/j.jneumeth.2014.03.004. Epub 2014 Mar 25. J Neurosci Methods. 2014. PMID: 24675050
-
Decoding Task-Specific Cognitive States with Slow, Directed Functional Networks in the Human Brain.eNeuro. 2020 Jul 13;7(4):ENEURO.0512-19.2019. doi: 10.1523/ENEURO.0512-19.2019. Print 2020 Jul/Aug. eNeuro. 2020. PMID: 32265196 Free PMC article.
-
Dynamic regional phase synchrony (DRePS): An Instantaneous Measure of Local fMRI Connectivity Within Spatially Clustered Brain Areas.Hum Brain Mapp. 2016 May;37(5):1970-85. doi: 10.1002/hbm.23151. Epub 2016 Mar 28. Hum Brain Mapp. 2016. PMID: 27019380 Free PMC article.
-
Investigating effective brain connectivity from fMRI data: past findings and current issues with reference to Granger causality analysis.Brain Connect. 2012;2(5):235-45. doi: 10.1089/brain.2012.0091. Brain Connect. 2012. PMID: 23016794 Free PMC article. Review.
Cited by
-
Effective connectivity underlying neural and behavioral components of prism adaptation.Front Psychol. 2022 Sep 2;13:915260. doi: 10.3389/fpsyg.2022.915260. eCollection 2022. Front Psychol. 2022. PMID: 36118425 Free PMC article.
-
Identifying effective connectivity parameters in simulated fMRI: a direct comparison of switching linear dynamic system, stochastic dynamic causal, and multivariate autoregressive models.Front Neurosci. 2013 May 14;7:70. doi: 10.3389/fnins.2013.00070. eCollection 2013. Front Neurosci. 2013. PMID: 23717258 Free PMC article.
-
Developmental sex differences in resting state functional connectivity of amygdala sub-regions.Neuroimage. 2015 Jul 15;115:235-44. doi: 10.1016/j.neuroimage.2015.04.013. Epub 2015 Apr 14. Neuroimage. 2015. PMID: 25887261 Free PMC article.
-
New concepts in brain networks.Front Syst Neurosci. 2012 Aug 10;6:56. doi: 10.3389/fnsys.2012.00056. eCollection 2012. Front Syst Neurosci. 2012. PMID: 22907995 Free PMC article. No abstract available.
-
Efficient posterior probability mapping using Savage-Dickey ratios.PLoS One. 2013;8(3):e59655. doi: 10.1371/journal.pone.0059655. Epub 2013 Mar 22. PLoS One. 2013. PMID: 23533640 Free PMC article.
References
-
- Abarbanel H. D. I. (1995). Analysis of Observed Chaotic Data. New York: Springer-Verlag
-
- Abarbanel H. D. I., Brown R., Sidorowich J. J., Tsimring L. S. H. (1993). The analysis of observed chaotic data in physical systems. Rev. Mod. Phys. 65, 1331–139210.1103/RevModPhys.65.1331 - DOI
-
- Alexander G. E., Moeller J. R. (1994). Application of the scaled subprofile model to functional imaging in neuropsychiatric disorders: a principal component approach to modeling brain function and disease. Hum. Brain Mapp. 2, 79–9410.1002/hbm.460020108 - DOI
Grants and funding
LinkOut - more resources
Full Text Sources