

Processing of retinal signals in normal and HCN deficient mice
- PMID: 22279546
- PMCID: PMC3261154
- DOI: 10.1371/journal.pone.0029812
Processing of retinal signals in normal and HCN deficient mice
Abstract
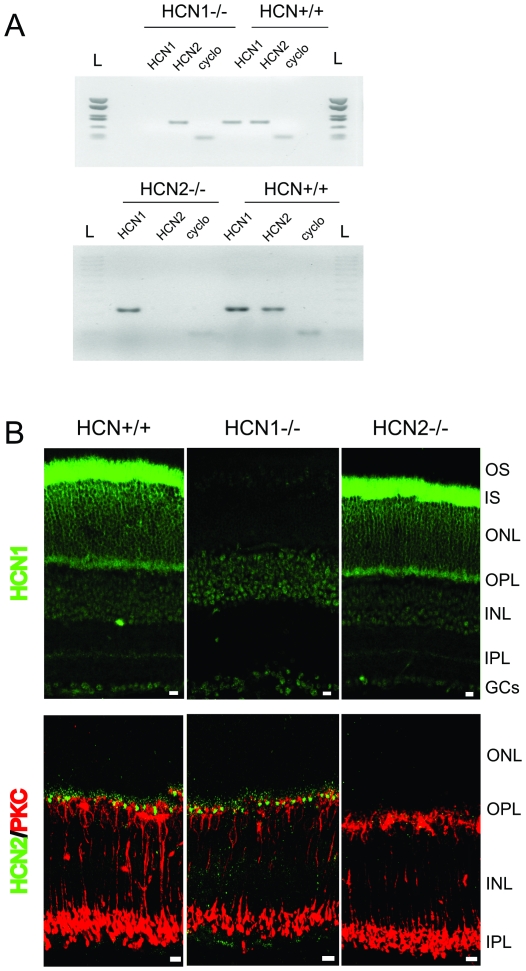
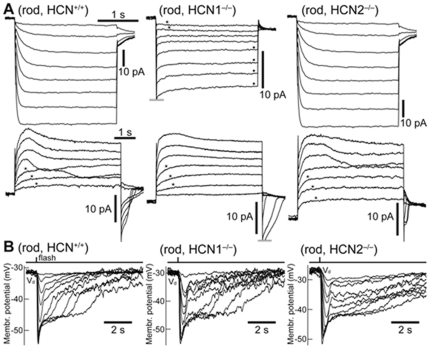
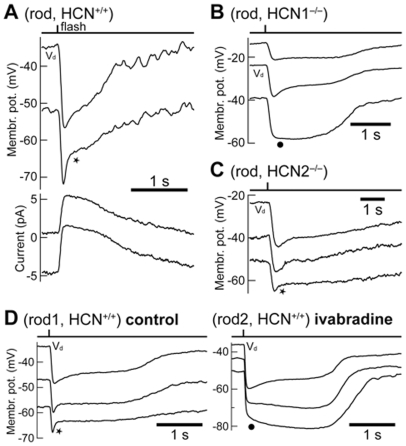
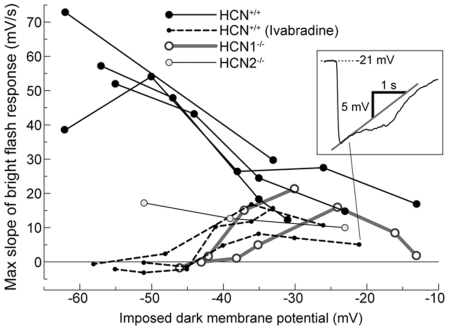
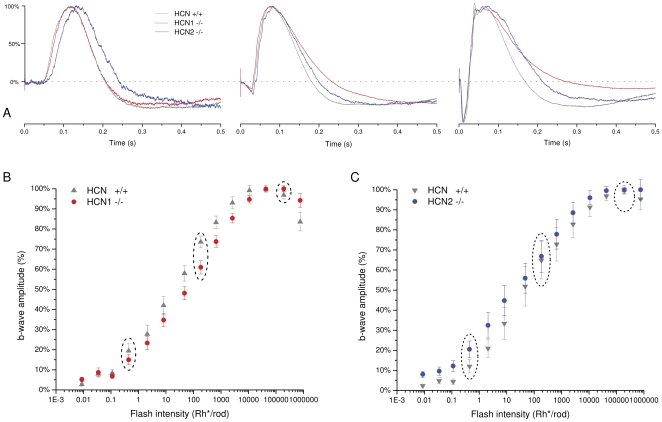
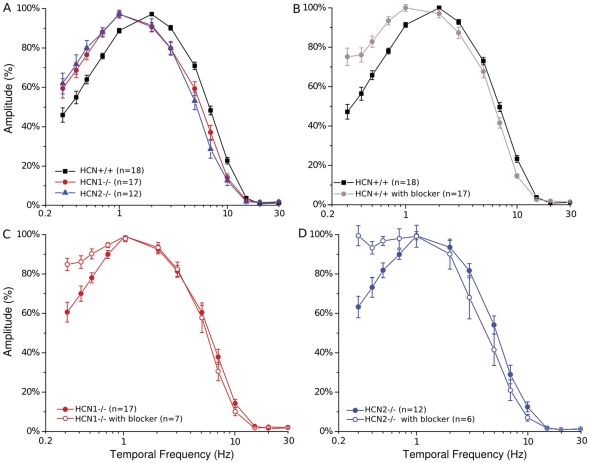
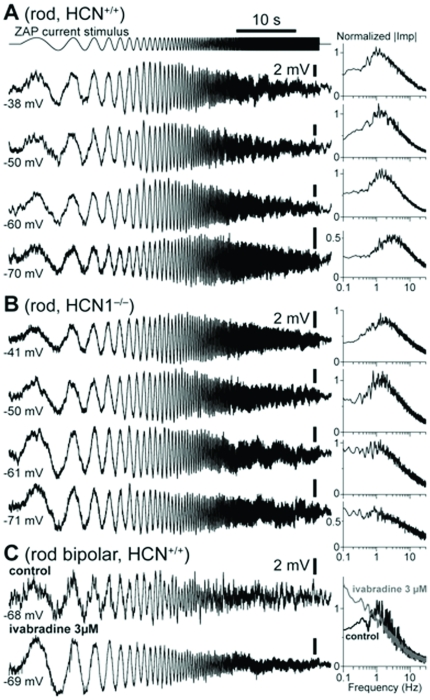
This study investigates the role of two different HCN channel isoforms in the light response of the outer retina. Taking advantage of HCN-deficient mice models and of in vitro (patch-clamp) and in vivo (ERG) recordings of retinal activity we show that HCN1 and HCN2 channels are expressed at distinct retinal sites and serve different functions. Specifically, HCN1 operate mainly at the level of the photoreceptor inner segment from where, together with other voltage sensitive channels, they control the time course of the response to bright light. Conversely, HCN2 channels are mainly expressed on the dendrites of bipolar cells and affect the response to dim lights. Single cell recordings in HCN1⁻/⁻ mice or during a pharmacological blockade of I(h) show that, contrary to previous reports, I(kx) alone is able to generate the fast initial transient in the rod bright flash response. Here we demonstrate that the relative contribution of I(h) and I(kx) to the rods' temporal tuning depends on the membrane potential. This is the first instance in which the light response of normal and HCN1- or HCN2-deficient mice is analyzed in single cells in retinal slice preparations and in integrated full field ERG responses from intact animals. This comparison reveals a high degree of correlation between single cell current clamp data and ERG measurements. A novel picture emerges showing that the temporal profile of the visual response to dim and bright luminance changes is separately determined by the coordinated gating of distinct voltage dependent conductances in photoreceptors and bipolar cells.
Conflict of interest statement
Figures
Similar articles
-
HCN1 Channels Enhance Rod System Responsivity in the Retina under Conditions of Light Exposure.PLoS One. 2016 Jan 25;11(1):e0147728. doi: 10.1371/journal.pone.0147728. eCollection 2016. PLoS One. 2016. PMID: 26807953 Free PMC article.
-
Low-conductance HCN1 ion channels augment the frequency response of rod and cone photoreceptors.J Neurosci. 2009 May 6;29(18):5841-53. doi: 10.1523/JNEUROSCI.5746-08.2009. J Neurosci. 2009. PMID: 19420251 Free PMC article.
-
Light responses in the mouse retina are prolonged upon targeted deletion of the HCN1 channel gene.Eur J Neurosci. 2008 Dec;28(11):2221-30. doi: 10.1111/j.1460-9568.2008.06512.x. Epub 2008 Nov 3. Eur J Neurosci. 2008. PMID: 19019198
-
HCN1 channels significantly shape retinal photoresponses.Adv Exp Med Biol. 2012;723:807-12. doi: 10.1007/978-1-4614-0631-0_103. Adv Exp Med Biol. 2012. PMID: 22183410 Review.
-
HCN channelopathies: pathophysiology in genetic epilepsy and therapeutic implications.Br J Pharmacol. 2012 Jan;165(1):49-56. doi: 10.1111/j.1476-5381.2011.01507.x. Br J Pharmacol. 2012. PMID: 21615728 Free PMC article. Review.
Cited by
-
Heteromeric KV2/KV8.2 Channels Mediate Delayed Rectifier Potassium Currents in Primate Photoreceptors.J Neurosci. 2018 Apr 4;38(14):3414-3427. doi: 10.1523/JNEUROSCI.2440-17.2018. Epub 2018 Feb 26. J Neurosci. 2018. PMID: 29483285 Free PMC article.
-
TRIP8b is required for maximal expression of HCN1 in the mouse retina.PLoS One. 2014 Jan 7;9(1):e85850. doi: 10.1371/journal.pone.0085850. eCollection 2014. PLoS One. 2014. PMID: 24409334 Free PMC article.
-
Clarifying the composition of the ATP consumption factors required for maintaining ion homeostasis in mouse rod photoreceptors.Sci Rep. 2023 Aug 29;13(1):14161. doi: 10.1038/s41598-023-40663-y. Sci Rep. 2023. PMID: 37644037 Free PMC article.
-
Light responses of mammalian cones.Pflugers Arch. 2021 Sep;473(9):1555-1568. doi: 10.1007/s00424-021-02551-0. Epub 2021 Mar 19. Pflugers Arch. 2021. PMID: 33742309 Free PMC article. Review.
-
How Azobenzene Photoswitches Restore Visual Responses to the Blind Retina.Neuron. 2016 Oct 5;92(1):100-113. doi: 10.1016/j.neuron.2016.08.038. Epub 2016 Sep 22. Neuron. 2016. PMID: 27667006 Free PMC article.
References
-
- Robinson RB, Siegelbaum SA. Hyperpolarization-activated cation currents: from molecules to physiological function. Annu Rev Physiol. 2003;65:453–480. - PubMed
-
- Biel M, Wahl-Schott C, Michalakis S, Zong X. Hyperpolarization-activated cation channels: from genes to function. Physiol Rev. 2009;89(3):847–885. - PubMed
-
- Mueller F, Scholten A, Ivanova E, Haverkamp S, Kremmer E, et al. HCN channels are expressed differentially in retinal bipolar cells and concentrated at synaptic terminals. Eur J Neurosci. 2003;17:2084–2096. - PubMed
-
- Fyk-Kolodziej B, Pourcho RG. Differential distribution of Hyperpolarization-Activated and cyclic Nucleotide-Gated channels in cone bipolar cells of the rat retina. J Comp Neurol. 2007;501:891–903. - PubMed
Publication types
MeSH terms
Substances
LinkOut - more resources
Full Text Sources
Molecular Biology Databases
