. 2012;7(1):e29848.
doi: 10.1371/journal.pone.0029848. Epub 2012 Jan 18.

Genetic signatures of exceptional longevity in humans

Affiliations

Genetic signatures of exceptional longevity in humans

Paola Sebastiani et al. PLoS One. 2012.

Abstract

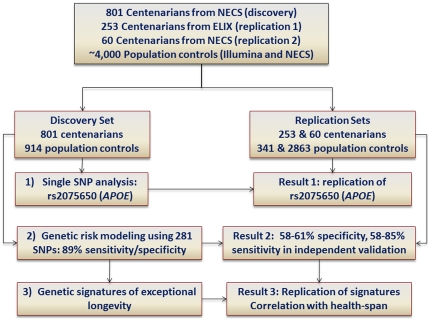
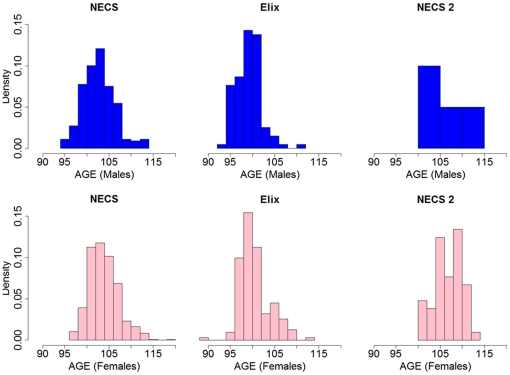
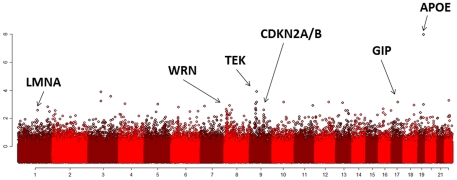
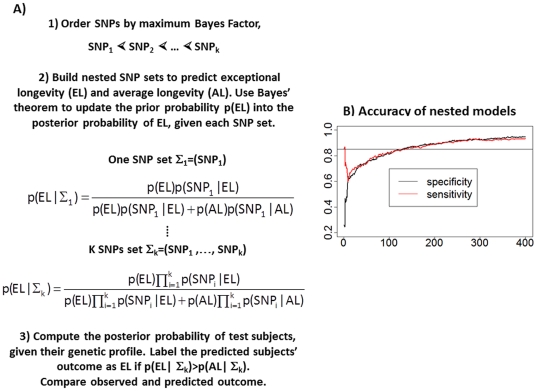
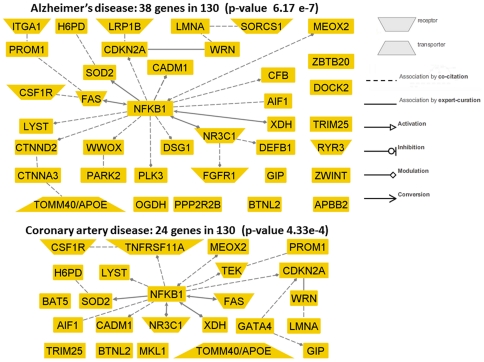
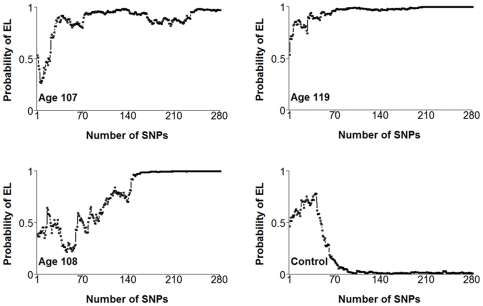
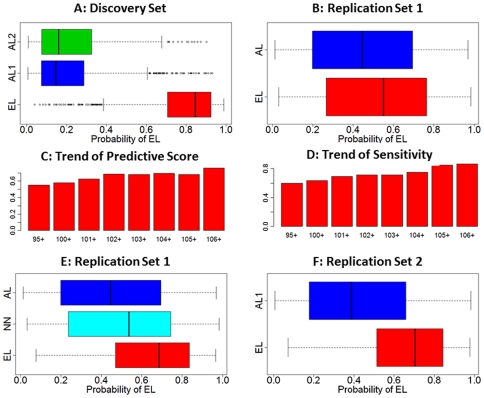
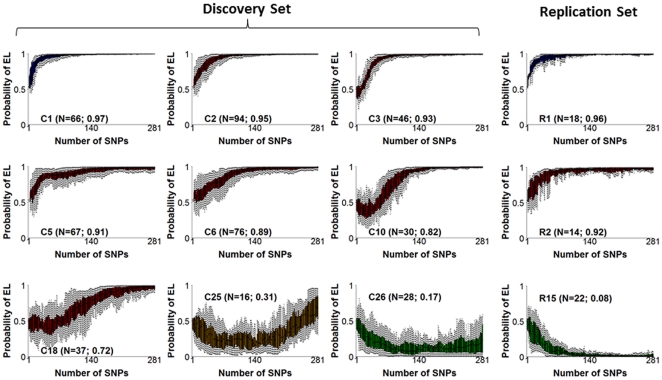
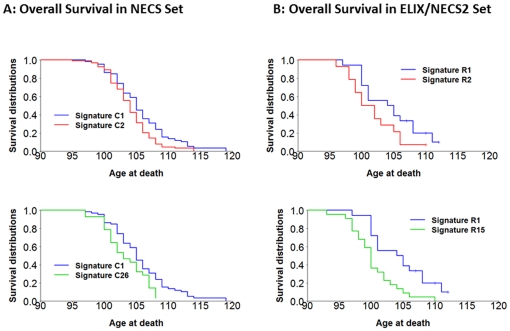
Like most complex phenotypes, exceptional longevity is thought to reflect a combined influence of environmental (e.g., lifestyle choices, where we live) and genetic factors. To explore the genetic contribution, we undertook a genome-wide association study of exceptional longevity in 801 centenarians (median age at death 104 years) and 914 genetically matched healthy controls. Using these data, we built a genetic model that includes 281 single nucleotide polymorphisms (SNPs) and discriminated between cases and controls of the discovery set with 89% sensitivity and specificity, and with 58% specificity and 60% sensitivity in an independent cohort of 341 controls and 253 genetically matched nonagenarians and centenarians (median age 100 years). Consistent with the hypothesis that the genetic contribution is largest with the oldest ages, the sensitivity of the model increased in the independent cohort with older and older ages (71% to classify subjects with an age at death>102 and 85% to classify subjects with an age at death>105). For further validation, we applied the model to an additional, unmatched 60 centenarians (median age 107 years) resulting in 78% sensitivity, and 2863 unmatched controls with 61% specificity. The 281 SNPs include the SNP rs2075650 in TOMM40/APOE that reached irrefutable genome wide significance (posterior probability of association = 1) and replicated in the independent cohort. Removal of this SNP from the model reduced the accuracy by only 1%. Further in-silico analysis suggests that 90% of centenarians can be grouped into clusters characterized by different "genetic signatures" of varying predictive values for exceptional longevity. The correlation between 3 signatures and 3 different life spans was replicated in the combined replication sets. The different signatures may help dissect this complex phenotype into sub-phenotypes of exceptional longevity.


Conflict of interest statement

Competing Interests: In the study the authors included 254 subjects enrolled at ELIXIR. There are no patents, products in development or marketed products to declare. This does not alter the authors' adherence to all the PLoS ONE policies on sharing data and materials.

Figures

Figure 1
Figure 1. Schematic showing the methodology used to discover genetic signatures of exceptional longevity (EL).
The analysis included genetic matching to remove confounding by population stratification between cases and controls of the discovery and replication set 1, discovery and replication of single SNP associations, multivariate genetic risk modeling and generation of predictive genetic profiles, and cluster analysis of genetic risk profiles to discover genetic signatures of EL.
Figure 2
Figure 2. Distribution of age of last contact or age at death of centenarians included in the study.
NECS: centenarians of the discovery set, ELIX: nonagenarians and centenarians from the ELIX replication set, NECS 2: additional NECS replication set of 60 centenarians. The y-axis reports the density, and the x-axis reports the age, in group of 2 years. The frequency of subjects with ages between x and x+2 is 2*density*(sample size).
Figure 3
Figure 3. The Manhattan plot displays the maximum log10(Bayes Factor) (y-axis) for each of the analyzed SNPs in the discovery set. The Manhattan plot displays the maximum log10(Bayes Factor) (y-axis) for each of the analyzed SNPs in the discovery set.
The SNPs are ordered by chromosome (alternate color bands) and, within chromosome, by physical position (x-axis). We tested the association of each SNP with exceptional longevity using general, allelic, dominant and recessive models and the y-axis reports the maximum log10(Bayes factor) observed for each SNP. The SNP rs2075650 in APOE/TOMM40 reached irrefutable genome wide significance (log10(MBF) = 7.9 and p-value<e-10). Figure S3 shows the Manhattan plot and QQ plot for the additive model using logistic regression.
Figure 4
Figure 4. A) Schematic illustration of the genetic risk prediction model.
We ordered SNPs by maximum Bayes Factor in the discovery set and built nested SNP sets starting with the most significant SNP and then adding one SNP at a time from the ordered list. The conditional probabilities of SNP genotypes in centenarians (p(SNPi|EL)) and controls (p(SNPi|AL)) are used to compute the posterior probability of exceptional longevity (p(EL|Σk)) using Bayes' theorem and prior probability p(EL) = 0.5. The classification rule is the standard Bayesian classification rule that is optimal under a 0–1 loss function. B) Sensitivity and specificity of 400 nested models. The x-axis reports the number of SNPs in each of the nested models, and the y-axis reports sensitivity (% of centenarians with posterior probability of exceptional longevity>posterior probability of average longevity) and specificity (% of controls with posterior probability of exceptional longevity<posterior probability of average longevity).
Figure 5
Figure 5. Genes in the genetic risk models have been linked to coronary artery disease and Alzheimer's disease.
The two networks display 38 of the 130 genes in the genetic risk model that are linked to Alzheimer's disease (top) and 24 of the 130 genes that are linked to coronary artery disease (bottom) in the literature, either by functional or genetic association studies. The nodes that are linked by an edge represents either genes that are “co-cited” (dashed lines) or “associated by expert curation” (continuous lines). The arrow head means that the associations are activation (triangle), inhibition (circle), modulation (diamond), conversion (arrow head). The node shape informs about known roles of the genes (see inset). The nodes that are singleton were linked to AD/CAD in the literature but not together with other genes. The number of genes linked to each disease was compared to what is expected by chance using Fisher exact test, and the p-values show that the gene seta are unluckily the result of chance. (Networks generated with Genomatix).
Figure 6
Figure 6. Examples of genetic risk profiles in 4 study subjects (3 centenarians with ages at death 107, 108 and 119 years, and a control).
281 nested SNP sets were used to compute the posterior probability of exceptional longevity in the 4 subjects (y-axis) and were plotted against the number of SNPs in each set (x-axis). In the 107 year old, the first 5 SNP sets Σ1 = [rs2075650], Σ2 = [Σ1, rs1322048], …, Σ5 = [Σ4, rs6801173] determine a posterior probability of exceptional longevity ranging between 0.54 and 0.28. This subject carries genotypes AA, AG, AG, CC, AA for the 5 SNPs respectively and, with the exclusion of genotype AA of rs2075650 that is more common in centenarians, the other genotypes are more common in controls than centenarians and determine a posterior probability of exceptional longevity that is lower than the posterior probability of average longevity. The sixth SNP set, Σ6 = [Σ5, rs337656], predicts an almost 30% chance of exceptional longevity. The subject carries the AA genotype for the SNP rs337656 that is more frequent in centenarians (Table S1), and carrying this genotype increases the posterior probability of exceptional longevity. The probability predicted by the next SNP sets increases steadily and all models with more than 20 SNPs predict more than a 50% chance of exceptional longevity. This genetic profile shows that the subject carries some combinations of SNP alleles that are associated with exceptional longevity, while other alleles are associated with “average longevity”. However, the overall genetic risk profile determined by all 281 SNP sets makes a strong case for exceptional longevity because the majority of models predict more than an 80% chance of exceptional longevity. The genetic risk profile of the centenarian who died at age 119 years is even more convincing: with the exception of the first SNP, all subsequent SNP sets determine more than a 70% chance of exceptional longevity, and 272 of the 281 models predict more than an 80% chance for exceptional longevity. This profile shows that this subject is highly enriched for SNPs alleles that are more common in centenarians (longevity associated variants) and that probably played a determinant role in the extreme survival. The profile of the third subject, age 108 years, shows that different SNP sets determine different chances for exceptional longevity, and only the overall trend of genetic risk provides evidence for exceptional longevity. The fourth plot displays the profile of a control, and shows that this subject carries some longevity associated variants; however, the overall trend of genetic risk points to average longevity rather than exceptional longevity.
Figure 7
Figure 7. Discrimination of the classification rule based on the ensemble of 281 genetic risk models.
Panel A: Posterior probability of exceptional longevity (EL) and average longevity (AL) (x axis) in the centenarians (red boxplots) and controls (AL1: Illumina controls, blue boxplots, AL2: NECS controls, green boxplots) of the discovery set (NECS, top left). Both sensitivity and specificity were 89%. The boxplots in blue and green show that the distributions of the posterior probability of EL in the two control groups are not statistically different (p-value from t-test comparing the posterior probability of EL = 0.21). Panel B: Posterior probability of EL and AL (x axis) in the centenarians (red boxplots) and controls of the replication set 1. Sensitivity and specificity were 60% and 58% and the distributions of the predictive score are significantly different (t-test p-value = 0.001). Panel C: Median values of the posterior probability of EL (predictive score) in subsets of centenarians of the replication set 1 with increasing ages. The barplot shows that the median score increases with older ages. Panel D: Sensitivity of the classification rule in subsets of centenarians of the replication set 1 with increasing ages. The barplot shows the increasing sensitivity in older groups that reaches 85% in 20 subjects aged 106 and older. Panel E: Distribution of the posterior probability of exceptional longevity in the 253 cases of the replication set divided into two age groups (<103 years, pale blue, mean age 99 years, and ≥103 years, red, mean age 106). The sensitivities in the two groups are 57% and 71.4%. The three distributions are significantly different (p-value = 0.04 from t-test comparing Illumina controls and centenarians aged <103; p-value = 0.004 from t-test comparing the centenarians stratified by age). Panel F: Sensitivity and specificity in an additional set of 2863 controls from the Illumina database (blue), and an additional set of 60 centenarians that include 39 centenarians enrolled since June 2009 (mean age 108) and 21 centenarians that were excluded from older analysis because of genetic matching (mean age 106). The specificity in the additional Illumina controls is 61.2%. The sensitivity in the additional centenarians was 71.5% in the set of 21, and 82% in the additional 39 for a total of 78% (p-value from t-test comparing the posterior probabilities of EL in controls and centenarians <1e-10).
Figure 8
Figure 8. Example of 9 clusters of genetic risk profiles in centenarians of the discovery set and 3 similar clusters in replication sets 1 and 2.
In each plot, the x-axis reports the number of SNPs in each genetic risk model (1,…,281), and the y-axis reports the posterior probability of exceptional longevity predicted by each model. The boxplots (one for each SNP set on the x axis) display the genetic risk profiles of the centenarians grouped in the same cluster. Numbers N in parentheses are the cluster sizes, and the average posterior probability of exceptional longevity. Color coding represents the strength of the genetic risk to predict EL (Blue: P(EL|∑281)>0.95; Red: 0.5<P(EL|∑281)<0.95; Orange: 0.20<P(EL|∑281)<0.5; Green: P(EL|∑281)<0.2). The full set of 26 clusters is in Figure S11 and includes more than 90% of centenarians in the discovery set.
Figure 9
Figure 9. Correlation of genetic signatures with lifespan.
Panel A: Some genetic signatures are associated with significantly different life-span. For example the most predictive signature (C1) comprises centenarians with significant longer survival compared to centenarians with signatures C2 or C26. (p-value 0.01 and 0.02) More examples are in Figure S15. Panel B: The two most predictive genetic signatures and the least predictive signature in the centenarians of the merged replications sets show consistent results. The comparison between survival of centenarians with the most predictive signature R1 and the least predictive signature R15 reaches statistical significance, (p-value = 0.003) while the comparison between survival distributions of centenarians with signatures R1 and R2 does not reach statistical significance (p-value 0.10).
Figure 10
Figure 10. Distribution of risk alleles of 1214 SNPs in 1054 centenarians (red) and 4118 controls (blue).
Risk alleles were derived from the GWAS catalogue at the NHGRI (downloaded in April 2011) and the Human Genome Mutation Database. The boxplots displays the rate of risk alleles carried by centenarians (red) and controls (blue). The disease described are: lupus, cholesterol level (Chol), macular degeneration (MD), Parkinson's Disease (PD), Chron's disease (chr), diabetes (diab), cardiovascular disease (CVD), cance (canc)r, Alzheimer's (AD), GWAS.pt is the group of alleles related to personality disorders that were found in GWAS, gwas.qt is the group of alleles related to QTL from GWASs and include cholesterol, BMI, obesity etc, and GWAS.cc is the group of risk alleles found from case/control GWASs so include for example cancer, PD, MD etc, cod is for coding variants from the HGMD, and all is the full set of 1214 variants. Table S3 reports the actual rates.

Similar articles

Cited by

References

    1. Fraser GE, Shavlik DJ. Ten years of life: Is it a matter of choice? Arch Intern Med. 2001;161:1645–1652. - PubMed
    1. Herskind AM, McGue M, Holm NV, Sorensen TI, Harvald B, et al. The heritability of human longevity: a population-based study of 2872 Danish twin pairs born 1870–1900. Hum Genet. 1996;97:319–323. - PubMed
    1. Alpert L, DesJardines B, Vaupel J, Perls Tt. Extreme longevity in two families. A report of multiple centenarians within single generations. In: Jeune BVJ, editor. Age Validation of the Extreme Old. Odense: Odense University Press; 1998.
    1. Perls T, Shea-Drinkwater M, Bowen-Flynn J, Ridge SB, Kang S, et al. Exceptional familial clustering for extreme longevity in humans. J Am Geriatr Soc. 2000;48:1483–1485. - PubMed
    1. Westendorp RG, van Heemst D, Rozing MP, Frolich M, Mooijaart SP, et al. Nonagenarian siblings and their offspring display lower risk of mortality and morbidity than sporadic nonagenarians: The Leiden Longevity Study. J Am Geriatr Soc. 2009;57:1634–1637. - PubMed

Publication types