. 2011 Jul-Dec;1(4):139-154.
doi: 10.4161/cl.1.4.18896. Epub 2011 Jul 1.

ArfGAP1 promotes COPI vesicle formation by facilitating coatomer polymerization

Affiliations

ArfGAP1 promotes COPI vesicle formation by facilitating coatomer polymerization

Yoko Shiba et al. Cell Logist. 2011 Jul-Dec.

Abstract

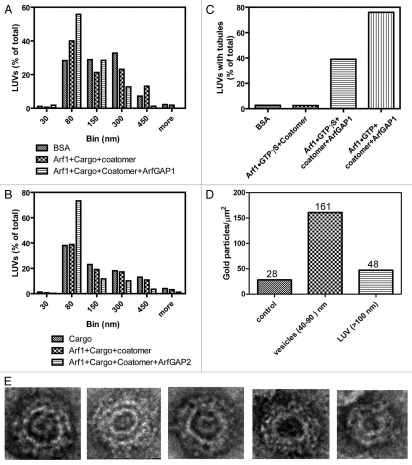
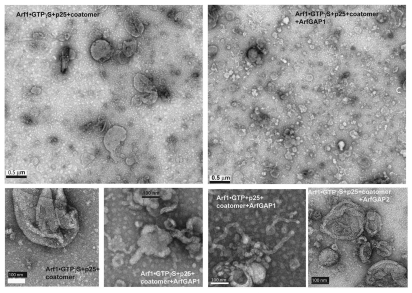
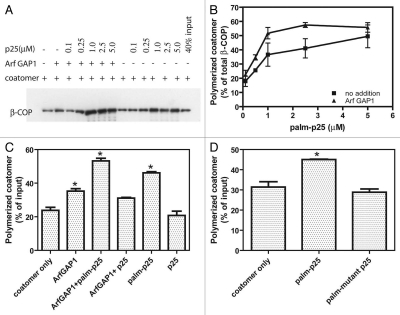
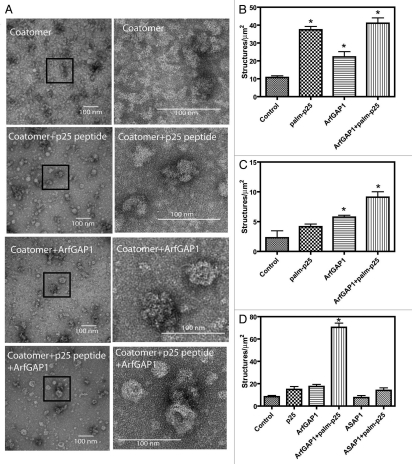
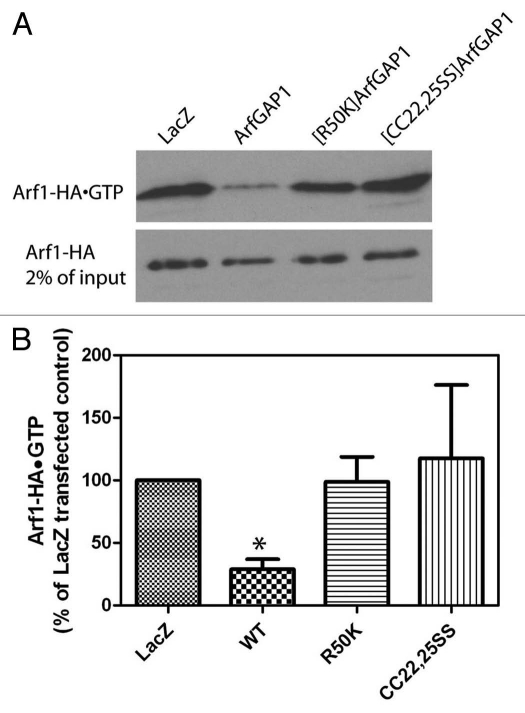
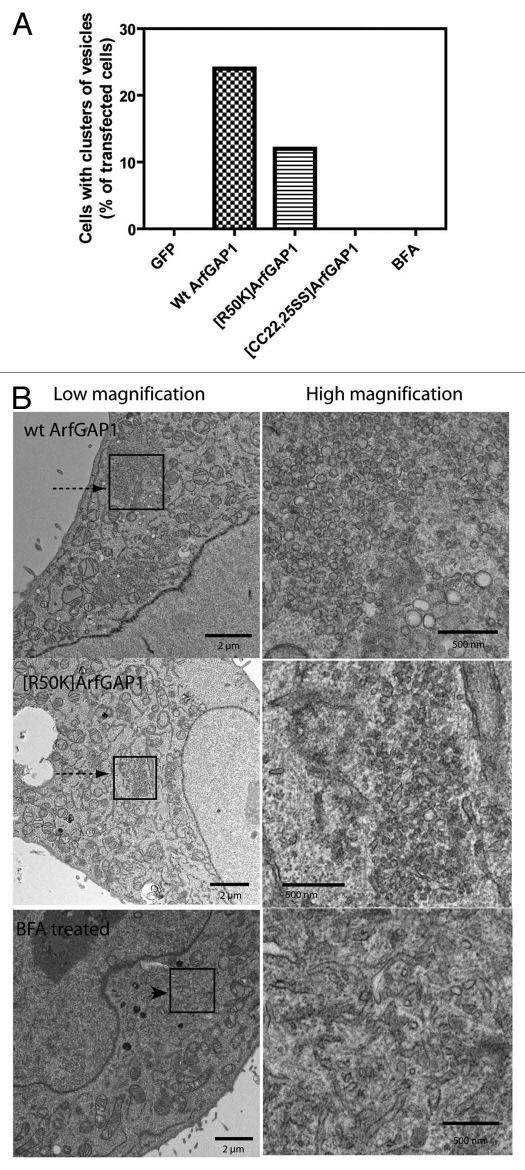
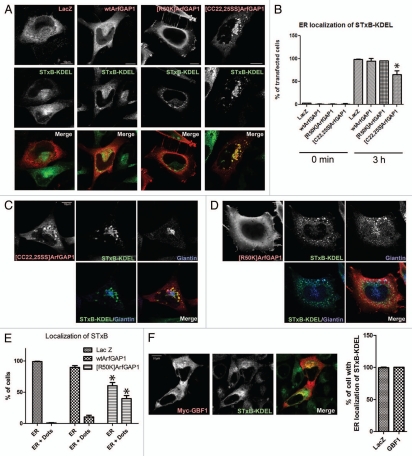
The role of ArfGAP1 in COPI vesicle biogenesis has been controversial. In work using isolated Golgi membranes, ArfGAP1 was found to promote COPI vesicle formation. In contrast, in studies using large unilamellar vesicles (LUVs) as model membranes, ArfGAP1 functioned as an uncoating factor inhibiting COPI vesicle formation. We set out to discriminate between these models. First, we reexamined the effect of ArfGAP1 on LUVs. We found that ArfGAP1 increased the efficiency of coatomer-induced deformation of LUVs. Second, ArfGAP1 and peptides from cargo facilitated self-assembly of coatomer into spherical structures in the absence of membranes, reminiscent of clathrin self-assembly. Third, in vivo, ArfGAP1 overexpression induced the accumulation of vesicles and allowed normal trafficking of a COPI cargo. Taken together, these data support the model in which ArfGAP1 promotes COPI vesicle formation and membrane traffic and identify a function for ArfGAP1 in the assembly of coatomer into COPI.

Keywords: ADP-ribosylation factor; ArfGTPase-activating protein; Golgi apparatus; coatomer; membrane traffic.


Figures

Figure 1
Figure 1
Effect of ArfGAP1 and ArfGAP2 on LUVs. LUVs were formed by extrusion through membrane with 1.0 µm pore size as described and consisted of 40% phosphatidylcholine (PC), 25% phosphatidylethanolamine (PE), 15% phosphatidylserine (PS), 9% phosphatidylinositol (PI), and 10% cholesterol and 1% phosphatidylinositol 4-phosphate (PI4P). LUVs were incubated with the proteins and peptide indicated in the figure at the following concentrations: bovine serum albumin (BSA), 5 µM; myrArf1•GTP⎳S, 0.1 µM; Arf1•GTP, 0.1 µM; ArfGAP1, 0.1 µM; ArfGAP2, 0.1 µM; coatomer, 0.124 µM; palmitoylated p25 peptide, 5 µM. LUVs were imaged by negative stained EM. (A) Effect of ArfGAP1 on LUV size distribution. LUVs were incubated with BSA, p25+Arf1•GTP⎳S+coatomer or p25+Arf1•GTP⎳S+coatomer+ArfGAP1. Diameters of the structures were determined using ImageJ for one of two experiments that were performed. At least 100 LUVs under each condition were examined. (B) Effect of ArfGAP2 on LUV size. The experiment was performed as described in (A) but with the indicated additions. The quantification shown is for one of two experiments. (C) ArfGAP1 induced tubulation of LUVs. The fraction of LUVs containing 2 or more tubules 20 nm in diameter and more than 50 nm in length was determined from the negative stained images. At least 100 LUVs were examined for each condition. (D) Association of coatomer with vesicles. LUVs were immunostained. Coatomer was detected using secondary antibody conjugated to 12 nm gold particles. Gold particles associated with the indicated structures was determined by examination of the negative stained images. The total number of particles associated with each structure is indicated over the bars. (E) Examples of 30–80 nm particles. LUVs were incubated with p25, Arf1•GTP⎳S, Coatomer and ArfGAP2.
Figure 2
Figure 2
ArfGAP1 and ArfGAP2 facilitate deformation of LUVs containing myrArf1•GTP, coatomer and p25 cargo peptide. LUVs were formed and incubated with the proteins and peptide as described in Figure 1. The combination of ArfGAP, myrArf1•GTP⎳S, palmitoylated p25 and coatomer are indicated on the figure. Concentrations of each are the same as in Figure 1. LUVs were stained with uranyl acetate and examined by transmission electron microscopy (TEM).
Figure 3
Figure 3
Effect of ArfGAP 1 and peptide from cargo cytoplasmic tail on coatomer polymerization. (A) Coatomer polymerization assay. Palmitoylated p25 cargo peptide was titrated into a reaction mixture containing purified coatomer and ArfGAP1, where indicated. Polymerized coatomer was sedimented by centrifugation. An example immunoblot is shown. (B) Quantification of sedimented coatomer. The sedimented proteins were fractionated using SDS-PAGE and detected using immunoblotting as in (A). The immunoblot data were quantified by scanning films for three experiments. Average ± SEM is presented. (C) Comparison of the effect of palmitoylated and unmodified peptide. Coatomer polymerization was determined as described in A in the presence of ArfGAP1 and either 1 µM palmitoylated p25 cargo peptide or 1 µM of the unmodified peptide. Data were analyzed by one way ANOVA followed by the Bonferoni multiple comparisons test for differences from coatomer only. * indicates p < 0.05. (D) Effect of mutant p25 on coatomer polymerization. The experiment was performed as described in (A) using palmitoylated p25 peptide or palmitoylated p25 with the phenylalanines changed to alanine and the two lysines changed to serine. Statistical analysis was performed as described in (C).
Figure 4
Figure 4
Effects of p25 peptide and ArfGAP1 on structure of coatomer. Coatomer incubated with the indicated proteins and peptides as described in Figure 3 was visualized by staining with uranyl acetate and examination by TEM as described in “Materials and Methods.” (A) shows representative images of coatomer incubated under the indicated conditions. The images in the right column are magnifications of the indicated areas in the images in the left column. (B–D) are from three experiments in which the number of spherical structures approximately 30 nm in diameter was determined. In (D), the effect of 0.5 µM [325–724]ASAP 1, an irrelevant ArfGAP, is determined. The average for 5 to 10 random fields ± sem is presented. Data were analyzed by one way ANOVA followed by the Bonferoni multiple comparisons test for differences from control. * indicates p < 0.05.
Figure 5
Figure 5
Arf1•GTP levels in cells overexpressing ArfGAP1 and mutant ArfGAP1. Cells were cotransfected with plasmids directing expression of Arf1-HA and the indicated ArfGAP1-myc. A part of the lysates was taken to determine Arf1-HA expression levels and the remaining lysates were used to determine Arf1-HA•GTP levels. (A) Representative experiment. (B) Quantification of 3 experiments. Films were digitized and the signal intensities determined using ImageJ. Normalized signals from 3 experiments were averaged. Data were analyzed by one way ANOVA followed by the Bonferoni multiple comparisons test for differences from control. * indicates p < 0.05.
Figure 6
Figure 6
Effect of ArfGAP1 and mutants on cell ultrastructure. HeLa cells were cotransfected with plasmids directing the expression of the indicated ArfGAP1 and with a plasmid for the expression of Lac Z. The cells were prepared for TEM as described in “Materials and Methods.” Random sections were examined and cells containing crystallized produced of the LacZ reaction, indicating transfection with LacZ, were analyzed. The % of cells with patches of vesicles was determined and is presented in (A). At least 24 cells were examined under each condition. Representative images of vesicle accumulation are shown in (B). Patches of vesicles are indicated by arrows. Tubular-vesicular accumulations are indicated by an arrowhead. High magnification images of the boxed areas are shown in the panels to the right.
Figure 7
Figure 7
Localization of ArfGAP1 and ArfGAP1 mutants when expressed at low levels. (A) Cellular distribution of exogenous ArfGAP1 with Arf. NIH 3T3 cells were transfected with plasmids directing expression of myc-tagged ArfGAP1 and mutants, as indicated, and stained with anti-Arf (red) and anti-myc (green). (B) Quantitative assessment of colocalization with Arf. Pearson's coefficients were determined for signals from Arf and ArfGAP1 and mutant ArfGAP1. The positive control was Arf1 stained with the same primary but secondary antibodies with different fluors. (C) Localization of exogenous ArfGAP1 relative to coatomer. Cells were treated as in A, then stained with anti-β-COP (green) and anti-myc (red) antibody. (D) Quantitative assessment of colocalization with β-COP. The experiment was performed as described in (C). The positive control used one primary for β-COP and two different secondary antibodies.
Figure 8
Figure 8
Effect of overexpressed wild-type and mutant ArfGAP1 on organellar morphology. (A) Golgi. Golgi morphology was analyzed using GM130 antibody in HeLa cells. Golgi morphology was classified into 2 classes depicted in the left panel, and more than 50 randomly chosen transfected cells were classified. The data are presented in the right panel, which is the summary of 3 independent experiments. Data were analyzed by two way ANOVA followed by the Bonferoni multiple comparisons test. * indicates p < 0.05 compared with GFP controls. (B) ERGIC. ERGIC morphology, analyzed using ERGIC53 antibody in HeLa cells, was grouped into 4 classes, depicted in the left panel, and quantified as in (A). The summary of the data is presented in the right panel. Statistical analysis was performed as descript in (A). (C) Expression level of ArfGAP1 and mutants. Protein expression was examined by immunoblotting lysates of HeLa cells. Wild-type and mutant ArfGAP1 were detected by anti-myc antibody. The non-specific band is indicated by an asterisk. (D) Relative localization of Golgi and ERGIC proteins in cells expressing [CC22,25SS]ArfGAP1. Cells expressing [CC22,25SS]ArfGAP1 were stained with antibodies against myc (for [CC22,25SS]ArfGAP1), GM130 and ERGIC53. (E) Effect of GBF1 on the Golgi and ERGIC. ArfGAP1 expression affected cells similarly to cells overexpressing GBF1. HeLa cells were transfected as indicated, and the cells were triple stained with anti-myc (not shown), anti-GM130 (green), and anti-ERGIC53 (red). The transfected cells were indicated by an asterisk.
Figure 9
Figure 9
Effect of recombinant ArfGAP1 on COPI dependent retrograde transport. COPI dependent transport was measured using STxB-KDEL conjugated with Alexa 488. (A) Relative distribution of STxB-KDEL and ArfGAP1-myc. STxB-KDEL conjugated with Alexa 488 fluorescence was internalized for 3hr in HeLa cells transfected with indicated constructs. After fixation, cells were stained with anti-myc antibody (red). Representative images are shown. (B) Quantitation of STxB-KDEL targeting to the ER. The percentage of transfected cells with a reticular distribution consistent with an ER localization of STxB-KDEL (referred to as ER localization) was determined. More than 50 cells were counted, and the summary of 3 independent experiments is shown. Data for the 3 h time point were analyzed by one way ANOVA followed by the Bonferoni multiple comparisons test. * indicates p < 0.05 compared with LacZ. (C) Distribution of STxB-KDEL in cells expressing [CC22,25SS]ArfGAP1. After internalization of STxB-KDEL (green) for 3 h, cells expressing [CC22,25SS]ArfGAP1 were stained for the Golgi marker giantin (blue) and [CC22,25SS]ArfGAP1 (red). STxB-KDEL localized at the perinuclear region, partially colocalizing with giantin but also was present in a structure connected to the Golgi. [CC22,25SS] ArfGAP1 colocalized with STxB-KDEL in the latter structure. (D) Distribution of STxB-KDEL in cells expressing [R50K]ArfGAP1. Cells expressing [R50K]ArfGAP1 were treated as described in C. The punctuate structure was also stained by giantin. (E) Quantification of relative reticular and punctate distributions illustrated in (D). The cells with STxB-KDEL localization that was reticular (presumed to be ER) or ER and puncta (dots) were shown as the percentage of transfected cells. Summary of 3 independent experiments is shown. Data were analyzed by two way ANOVA followed by the Bonferoni multiple comparisons test. * indicates p < 0.05 compared with Lac Z control. (F) Relative distribution of STxB-KDEL and GBF1-myc, and quantification of STxB-KDEL localization. STxB-KDEL was internalized as above, and ER localization of STxB-KDEL is shown as the percentage of transfected cells.

Similar articles

Cited by

References

    1. Kahn RA, Bruford E, Inoue H, Logsdon JM, Nie Z, Premont RT, et al. Consensus nomenclature for the human ArfGAP domain containing proteins. J Cell Biol. 2008;182:1039–1044. doi: 10.1083/jcb.200806041. - DOI - PMC - PubMed
    1. Gillingham AK, Munro S. The small G proteins of the Arf family and their regulators. Annu Rev Cell Dev Biol. 2007;23:579–611. doi: 10.1146/annurev.cellbio.23.090506.123209. - DOI - PubMed
    1. Inoue H, Randazzo PA. Arf GAPs and their interacting proteins. Traffic. 2007;8:1465–1475. doi: 10.1111/j.1600-0854.2007.00624.x. - DOI - PubMed
    1. Nie Z, Randazzo PA. Arf GAPs and membrane traffic. J Cell Sci. 2006;119:1203–1211. doi: 10.1242/jcs.02924. - DOI - PubMed
    1. Rothman JE. The machinery and principles of vesicle transport in the cell. Nat Med. 2002;8:1059–1062. doi: 10.1038/nm770. - DOI - PubMed

LinkOut - more resources